Bitcoin Price Analysis: 27 February

Disclaimer: The findings of the following analysis are the sole opinions of the writer and should not be taken as investment advice
According to data shared by CryptoQuant, U.S institutional investors are still buying massive amounts of Bitcoin, despite the cryptocurrency trading near the $48,000-range. This is a long-term bullish development that lends some weight to the argument that the floor for this drop has already been tested, being the $44,000-$46,000 range.
In the short-term, however, there are still multiple levels of resistance Bitcoin has to overcome.
Bitcoin 1-hour chart
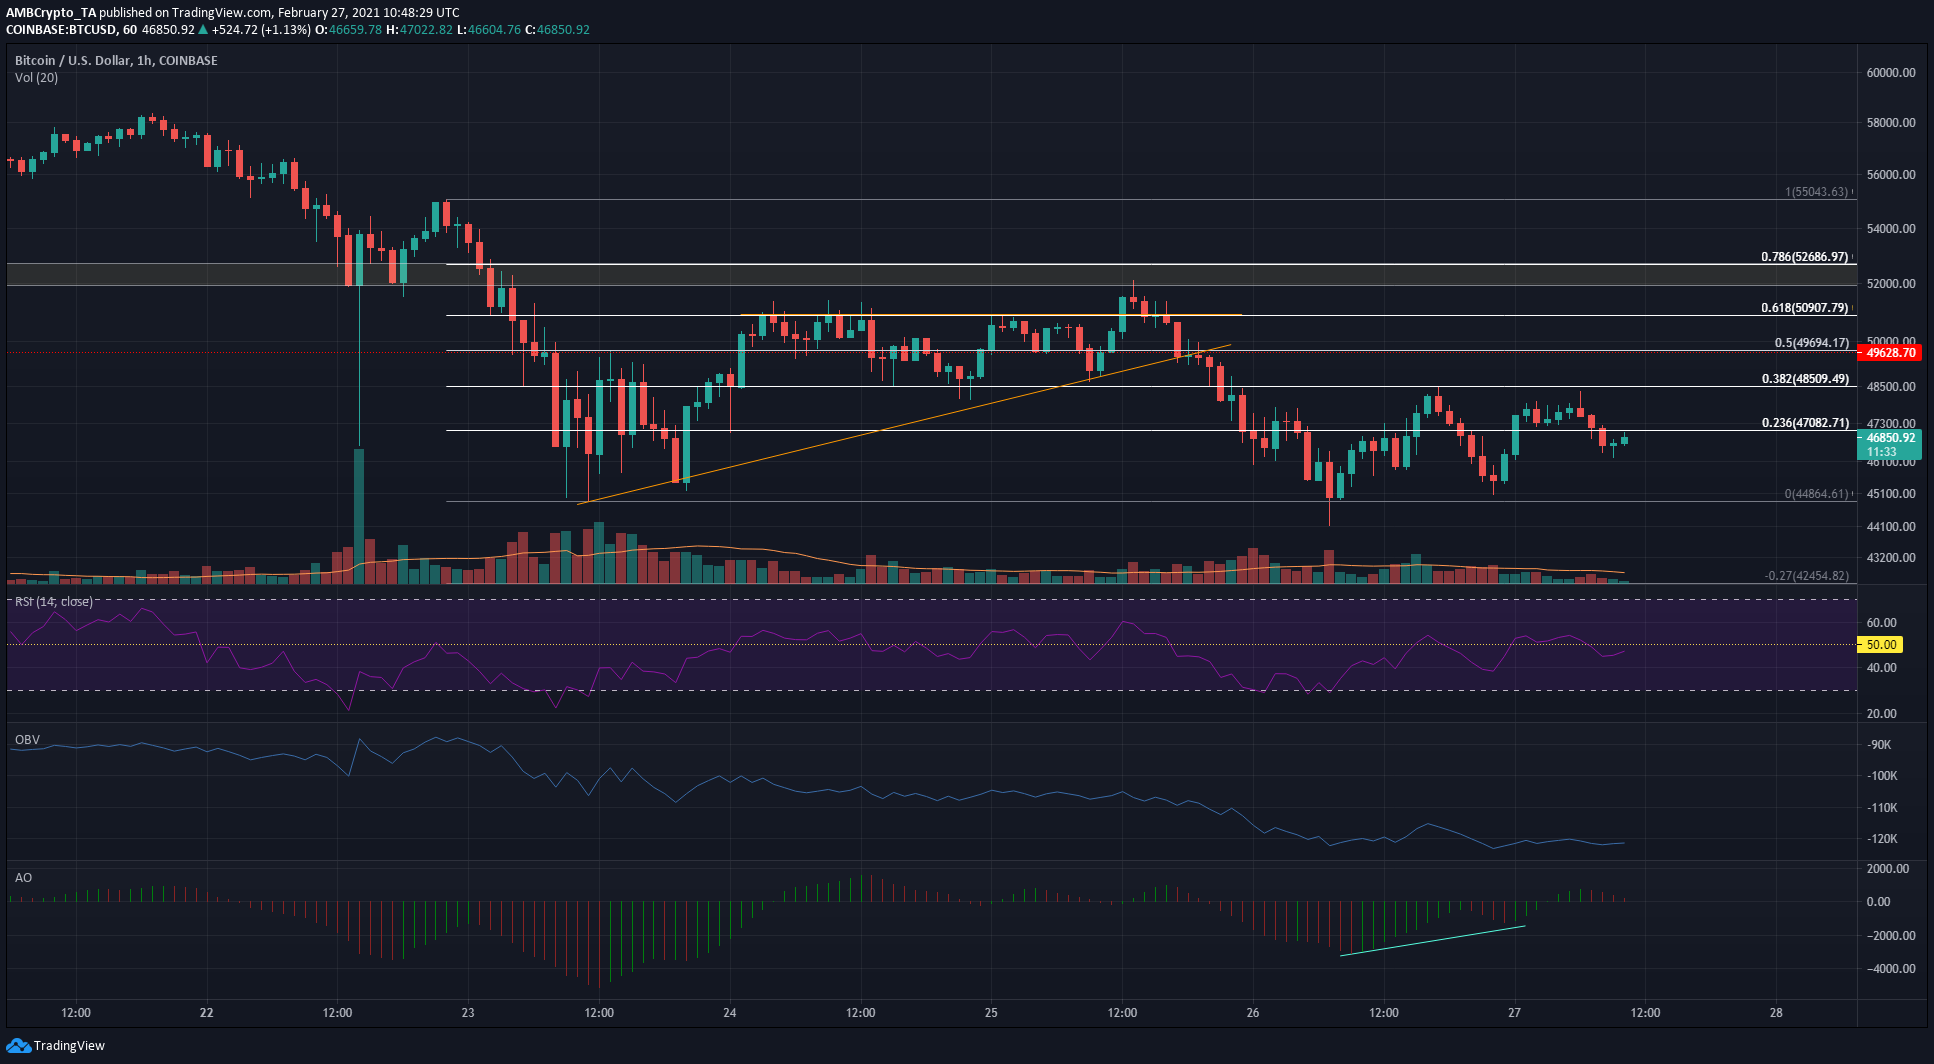
Levels of resistance and support for BTC in the short-term were highlighted on the crypto’s one-hour chart using the Fibonacci retracement tool for its drop from $55,000 to $44,864. Here, most notable were the 50% and 61.8% retracement levels at $49,700 and $50,900.
There was also a region of supply in the vicinity of $52k, a zone that seemed to be an impediment to the bulls’ attempts at recovery. It was a region that saw a strong rejection very recently, forcing BTC to revisit the $45,000 lows once more.
The defense of $45,000 can be seen as a bullish development, one that hinted at a double bottom with the price registering higher lows since. And yet, in the short-term, an optimal risk-to-reward trade for BTC wasn’t available at press time, with the same likely to develop soon.
Reasoning
The technical indicators showed some conflicting signs on the hourly chart. The Awesome Oscillator presented a bullish twin peak setup, a buy signal. On the contrary, the OBV did not note a significant shift in favor of the buyers, nor did trading volume jump after the price recovered from $45,000. The trading volume, in particular, was something of significance here – A rising volume trend alongside a rising price is the surest sign of an imminent recovery past $52,000.
The RSI meandered about the 50-mark, highlighting no strong momentum in either direction.
Over longer timeframes such as the 4-hour, 6-hour, and 12-hour charts, there was some conflict too. The 4-hour charts showed a bullish divergence, while the 6 and 12-hour charts had not yet reacted and remained bearish.
Conclusion
In the short-term, sustaining a breach of $47,000 would see Bitcoin retest the $51,000-$52,000 levels, despite the fact that trading volume, a crucial component of a strong rally, was missing at press time. The bottom at $45,000 seemed to be the floor, however, and losing this level would see Bitcoin drop to $40,900 or even lower.