What will Bitcoin’s price discovery beyond its latest ATH look like?

Price discovery beyond $20,000 was a pipe dream for both institutional and retail traders two weeks ago. Now, with Bitcoin trading at $23,511 at the time of writing, there is a lot of anticipation around further price discovery. Interestingly, Bitcoin’s mean transaction volume (2d MA) has fallen significantly in the past 24-hours, with the current value down 20% from 8.5 BTC to 6.86 BTC
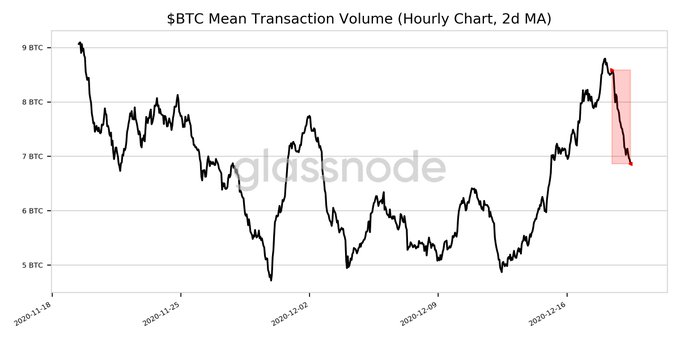
Now, in light of the said data from Glassnode, as the transaction volume plummets, will the price drop too? Well, this would signal a correction, rather than further price discovery above BTC’s press time price.
The fall in mean transaction volume suggests that the activity on the network is declining. With retail traders getting used to trading Bitcoin above $23,000, there has been a drop in activity and this could be attributed to the drop in demand on spot exchanges. There are more traders who have created a sell wall than those lining up to buy Bitcoin as it continues to remain undervalued at the current price level.
Whether this suggests a pullback or not, the same can be examined through another metric – Bitcoin’s Spent Outputs. Bitcoin Spent Outputs have increased significantly, based on data from Glassnode.
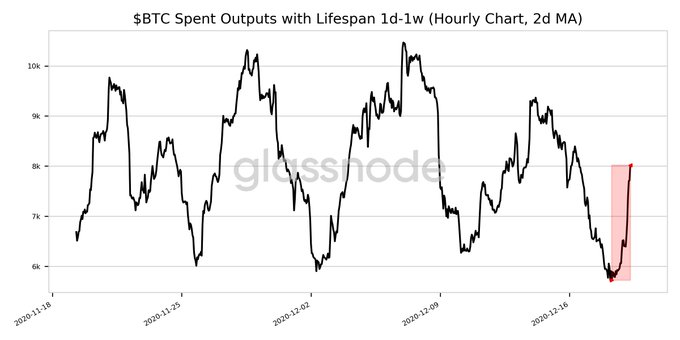
Bitcoin’s spent outputs have risen and the last time this happened, the cryptocurrency’s price climbed steadily on the charts. It traded above the $19000-range for a long time, before crossing $20,000 and discovering price further. This may be indicative of discovery beyond BTC’s press time levels, closer to the $25000-range, once there is further stability and drop in volatility.
It is also important to factor in that the active supply is climbing up steadily, something that means more than one thing. On the one hand, increased network activity is directly linked to an increase in transactions, transaction volume, and bullishness. On the other hand, it is related to further price discovery above its press time price level.
Based on the chart, the biggest % of spent Bitcoins in the active supply were bought in 2020. These charts suggest that a correction may be due, however, the price rally and price sustaining above $23,000 suggests that the outcome may be contrary. It is possible, therefore, that the price might steadily continue to climb towards $25,000.


