Litecoin Price Analysis: 20 December

Disclaimer: The findings of the following analysis are the sole opinion of the writer and should not be taken as investment advice
Litecoin supporters still value it, which is the only reason it is still around. Apart from being considered as the silver to Bitcoin’s gold and having cheaper, faster transactions, it doesn’t seem to be serving much of a purpose. However, considering it has survived the bear market and massive crashes, it seems to be doing something right.
Litecoin recorded a 58% pump in the last 3 days, but it dropped by 2.34% in the last 24 hours. The following article takes a look at Litecoin’s price and the possible scenarios.
Litecoin 1-day chart

Despite surging by 58% in the last 3 days and registering a year-to-date [YTD] return of 182%, Litecoin is nowhere near its all-time high [ATH]. In fact, Litecoin needs to surge by 257% to hit its previous ATH of $420.
The attached chart underlines 3 important curves that matter, for now, the red curve, which extends all the way from 2017 to press time, the cyan and the purple curve, which extend from 2019 to press time.
The red curve has four major points of contact, the top of 2017 and the 2020 top, which was hit recently. The other two are important too since they were pre-bull run spikes that evolved into a correction that caused the bull run.
The purple curve shows the actual course LTC should have taken. However, considering its recent surge which was parabolic, things seem to have gone out of control. More often than not, parabolic surges lead to corrections, and finding these corrections could help – trade the correction, provide a long entry position, or an opportunity to simply buy more of the asset. The purple and the cyan curve try to do just that. Hence, we can approximate that the next drop will be towards the cyan curve.
Catching a falling knife
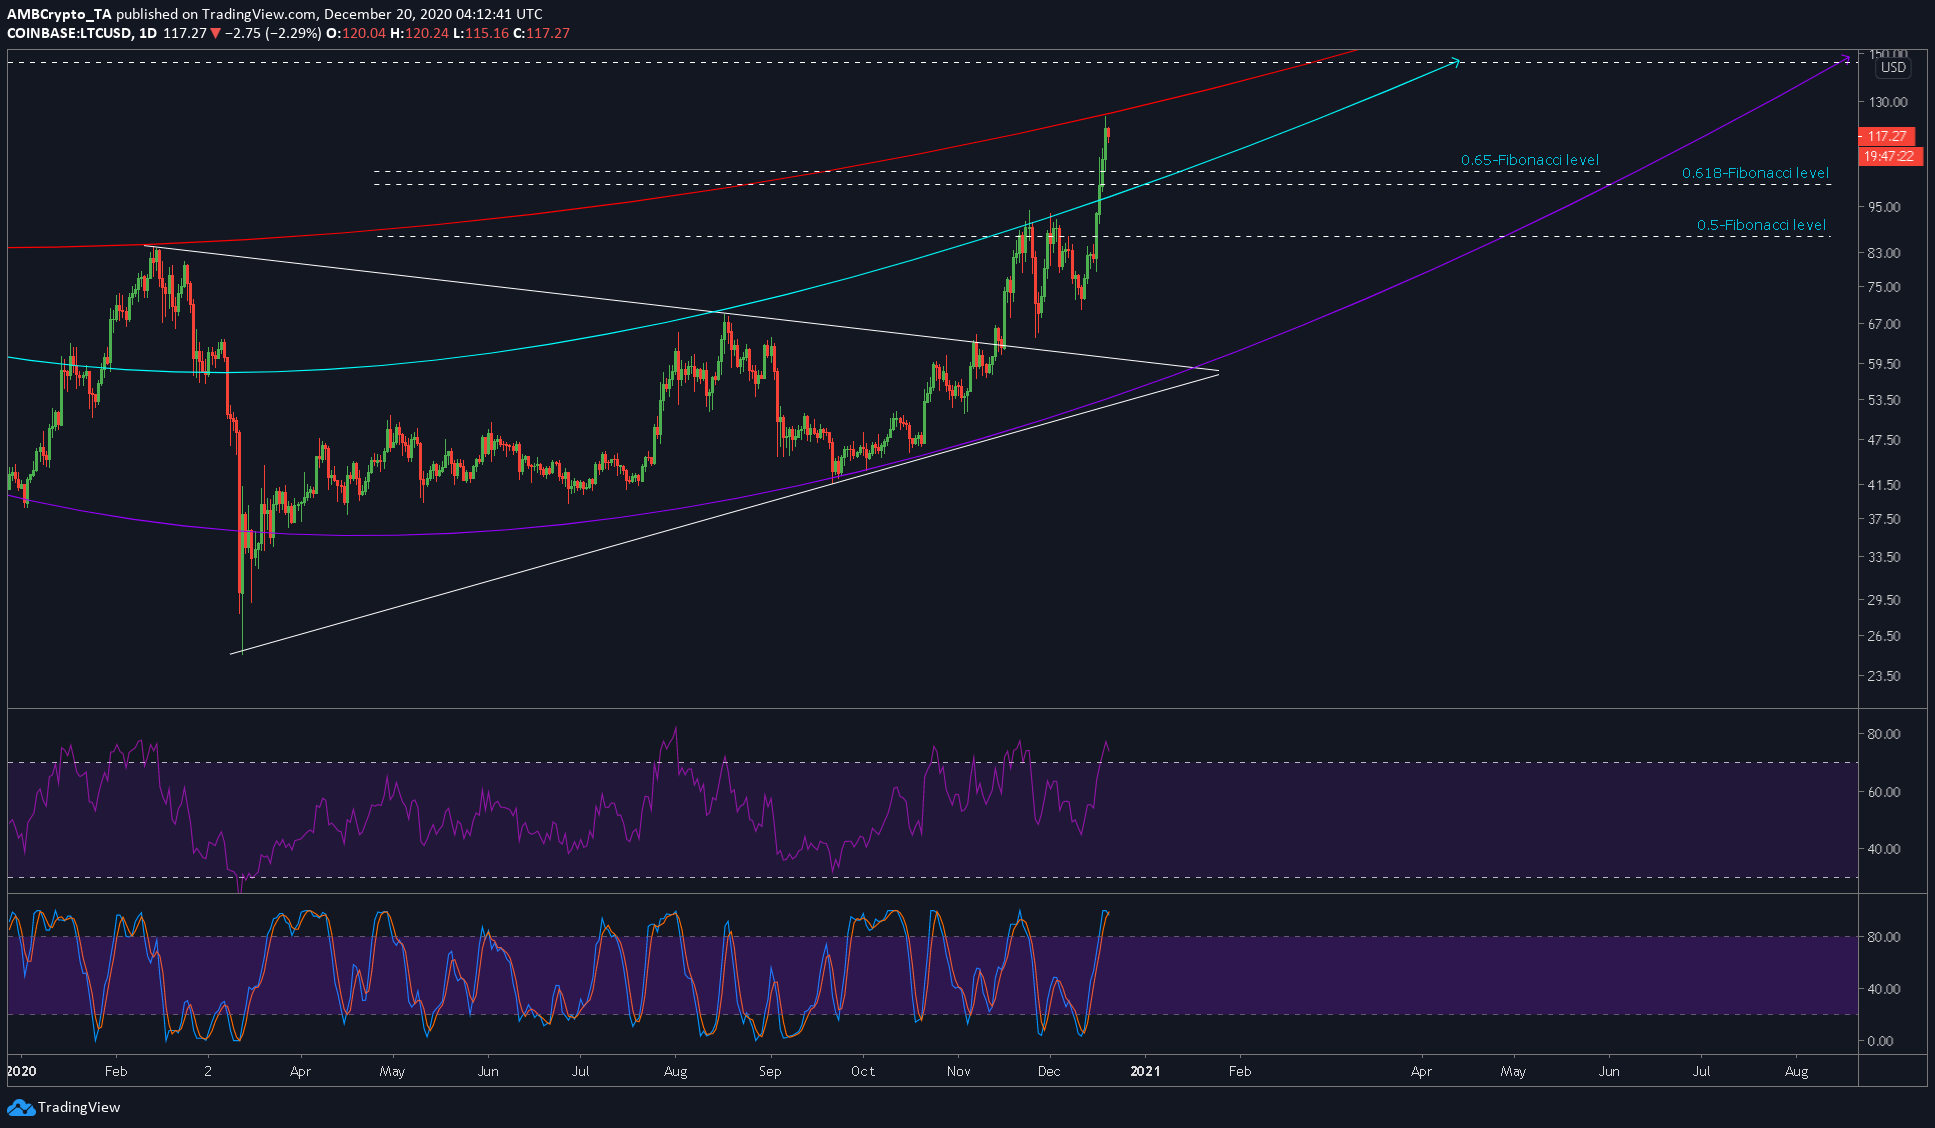
The attached chart shows clearly that the drop is already occurring and using a trend-based Fibonacci level, we can conclude that the price seemed to be facing overhead pressure from the 0.786-Fibonacci level, a level that caused it to drop.
If this continues and it will, since the RSI and the Stochastic RSI were both in the overbought zone and hinted at a reversal soon, we can expect the drop to find support at the 0.618-Fibonacci level [$101.48] or the 0.5-Fibonacci level [$86.88].
This would mean that Litecoin could drop by 10% to 12% soon. This will hold true as long as Bitcoin continues to either move sideways or drop. However, if Bitcoin surges again, then altcoins, including Litecoin, will promptly follow.