Bitcoin

Bitcoin price undergoes sideways movement as bears fail to take assertive control
Posted:
| Last updated: December 21st, 2022

Bitcoin’s price continued to demonstrate little to none price activity in the charts as the virtual asset consolidated above the $10,000. The recorded market cap at press time was around $181 billion and the trade volume remained under $15 billion, at $14.86 billion. The coin was priced at $10,120.79 and it suffered a devaluation of 1.45 percent over the past day.
BTC was traded the most on the LAToken exchange which was responsible for $402 million of the overall trade.
1-hour chart
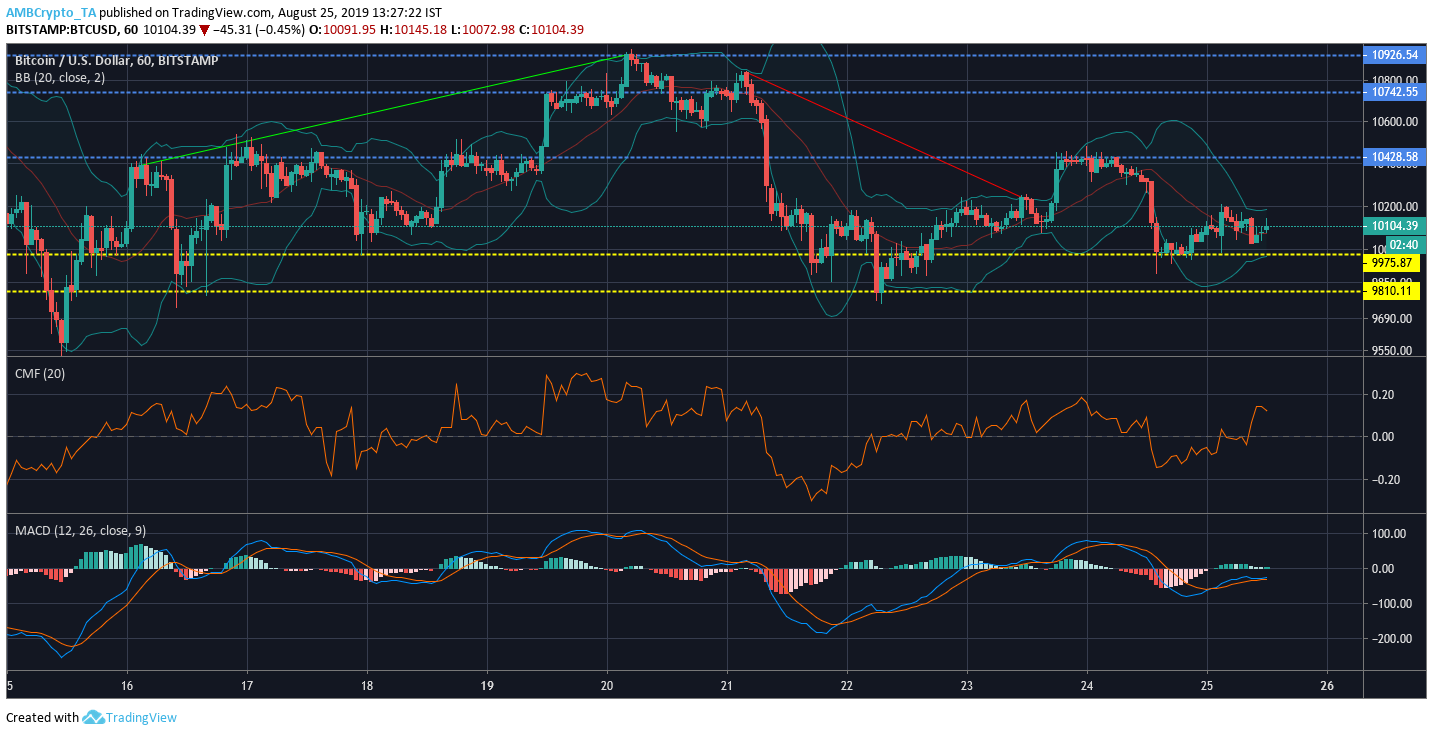
Source: Trading View
Resistance 1: $10926.54
Resistance 2: $10742.55
Resistance 3: $10428.58
Support 1: $9945.87
Support 2: $9810.11
The short term chart of Bitcoin witnessed an uptrend which stretched the valuation from $10,393.22 to $10931.55 but it was immediately followed by a downtrend. The downtrend took the price down, slumping for a value of $10835.38 to $10,239.05, which saw the price drop below the resistance of $10,428.58.
The Bollinger Bands were diverging the charts which indicated imminent market volatility.
The Chaikin Money Flow or CMF line suggested that capital moving in the market was greater than capital flowing out.
The MACD line remained bullish on the short term as the blue line hovered over the red line at press time.
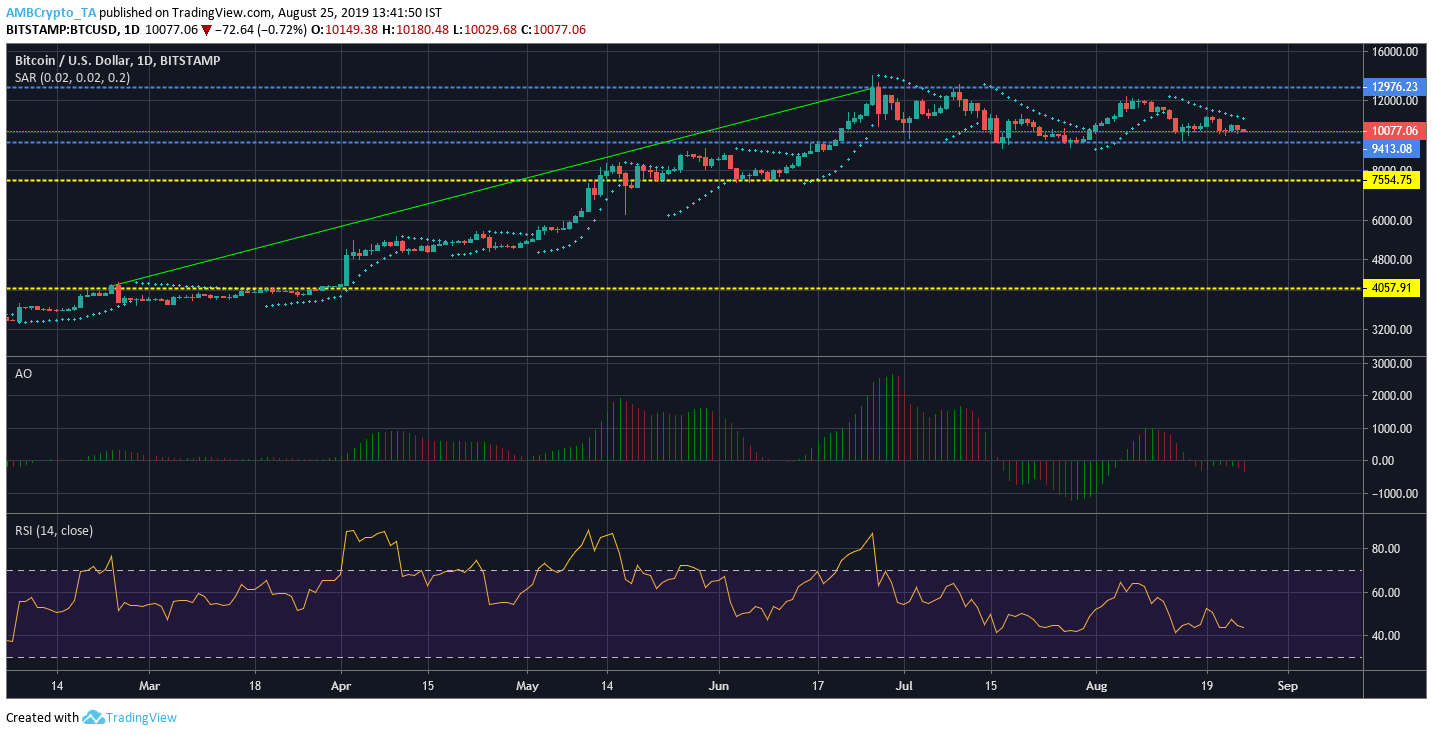
Source: Trading View
Resistance 1: $12,976.23
Resistance 2: $9413.08
Support 1: $7554.75
Support 2: $4057.91
The long term chart of BTC indicated that the price of bitcoin had consolidated between Resistance 1 and Resistance 2 over the time period. After the bull run which stretched from April to June, the price attained sideways movement without any resistance breach. The coin also witnessed a massive uptrend earlier which took its price from $4081.58 to $12,864.70.
The Parabolic SAR remained bearish for the coin as the dotted markers resided above the candlesticks.
The Awesome Oscillator exhibited the appearance of red bars but the bearish momentum was fairly weak.
The Relative Strength Index or RSI indicated neutrality between the over-sold and over-bought section in the charts.
Conclusion
The indicators of the short-term and long-term charts were not definitive towards a particular trend as the bulls and bears both slacked behind in the market.