Bitcoin slips beneath $16.7k, but here are two support levels to watch out for

Disclaimer: The information presented does not constitute financial, investment, trading, or other types of advice and is solely the writer’s opinion
- The market structure of Bitcoin was bearish on higher timeframes
- December’s lows at $16,256 could be tagged before a move higher, but should you buy the dip?
The sentiment behind Bitcoin has been fearful in recent months. The fall of FTX and the FUD around Binance aided the sellers, and the bulls had their backs to the walls and no way out yet.
The news of inflation from the US Federal Reserve and their attempts to combat it meant we could see a few more months of the bear market, at least.
Read Bitcoin’s Price Prediction 2023-24
Volatility reduced in recent weeks, and this could see a violent move in the coming weeks. A move downward could force large liquidations, and help form a long-term bottom. At the time of writing, the market was bearishly biased.
The 12-hour bearish breaker remains unbeaten, BTC has bounced from $16,450 multiple times as well
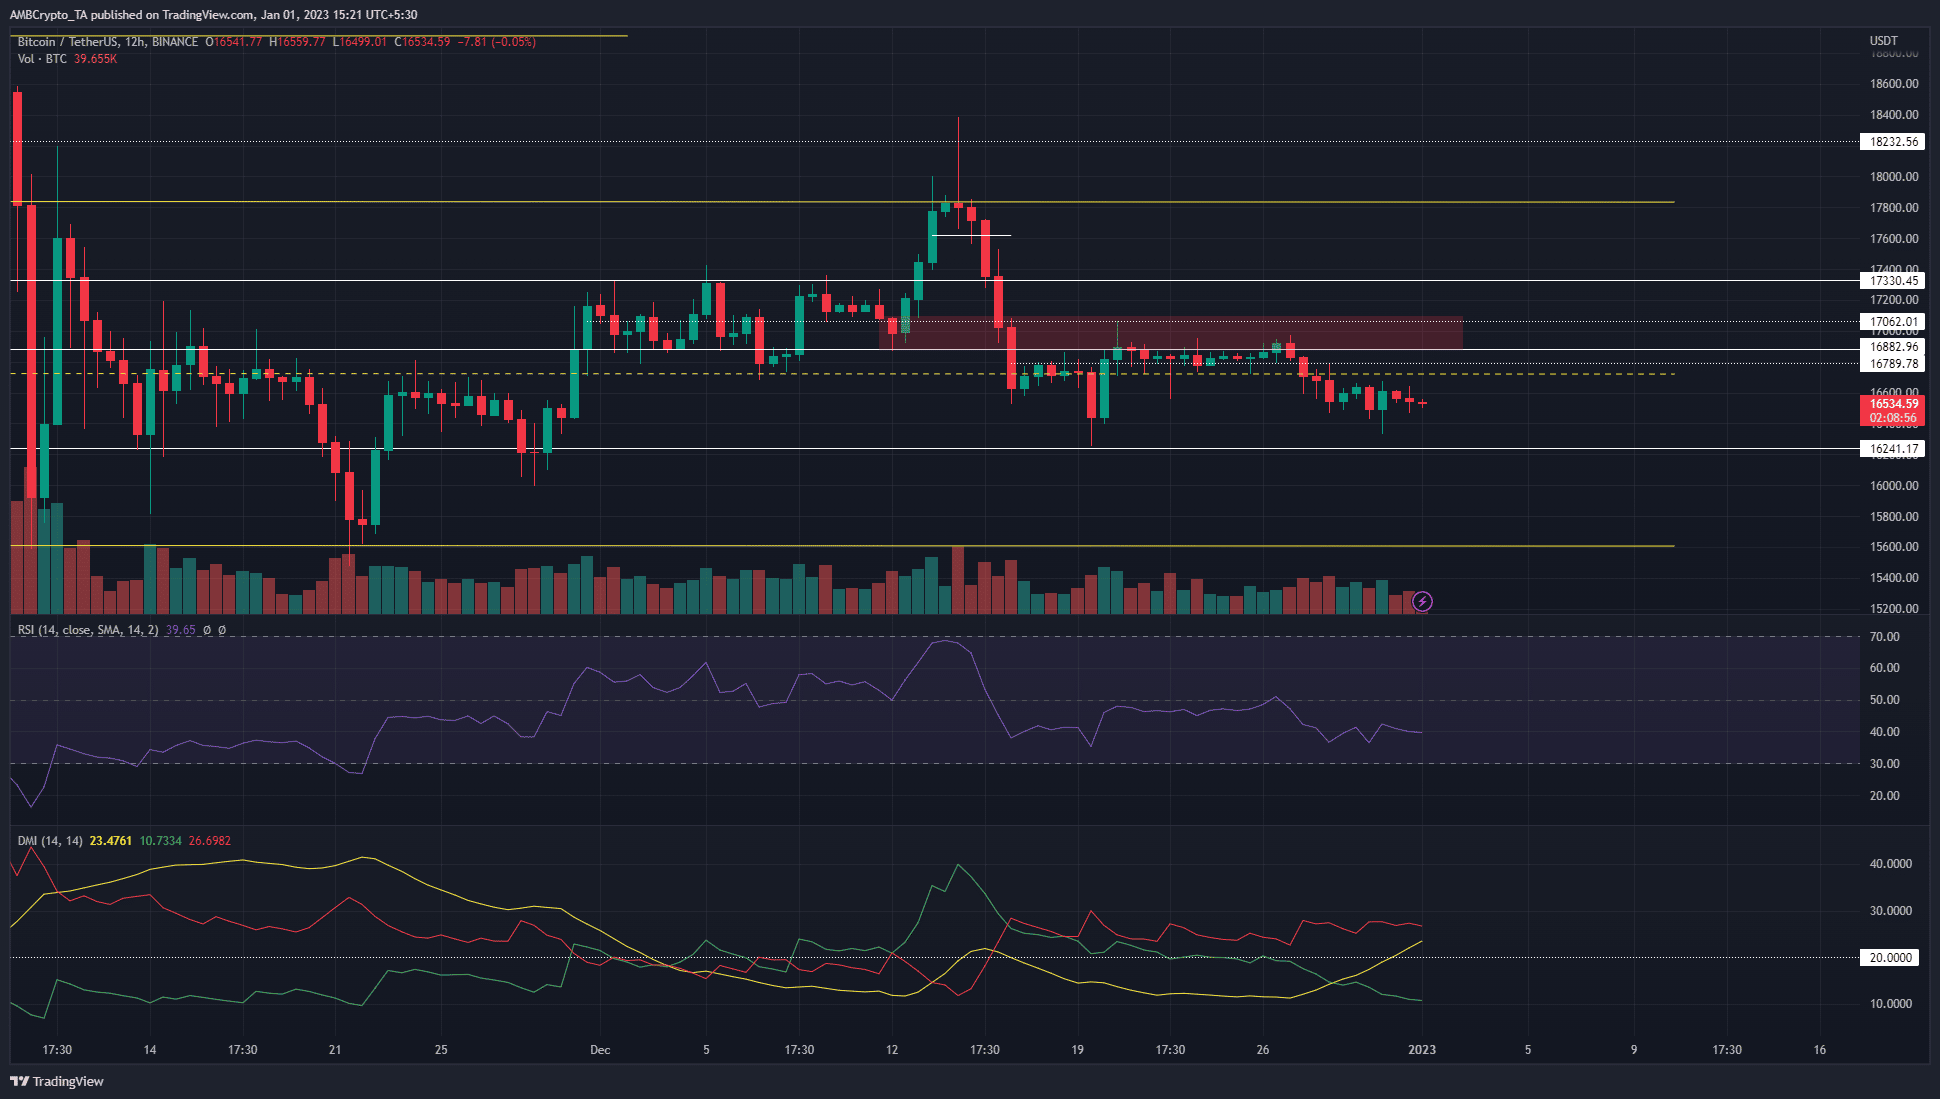
The Directional Movement Index (DMI) indicator showed a bearish trend was picking up strength. The Average Directional Movement (ADX) line (yellow) crossed over the 20 mark, while the -DI was also above 20 to show a significant downward trend in progress. The price action also agreed with the findings of this indicator.
BTC bounced between the $17k mark and the $16.4k area multiple times in the past two weeks. Since mid-December, after the drop from $17.8k, the market structure took a bearish bias as the higher low at $17k from 12 December was broken.
In doing so, the price also broke beneath the bullish order block and flipped it to a bearish breaker, highlighted by the red box. Additionally, a move back above the $17k level would give some bullish impetus to BTC.
The Relative Strength Index (RSI) continued to move beneath the neutral 50 mark to show bearish momentum behind the king of crypto.
The mean coin age dwindles as the MVRV ratio dips into negative territory
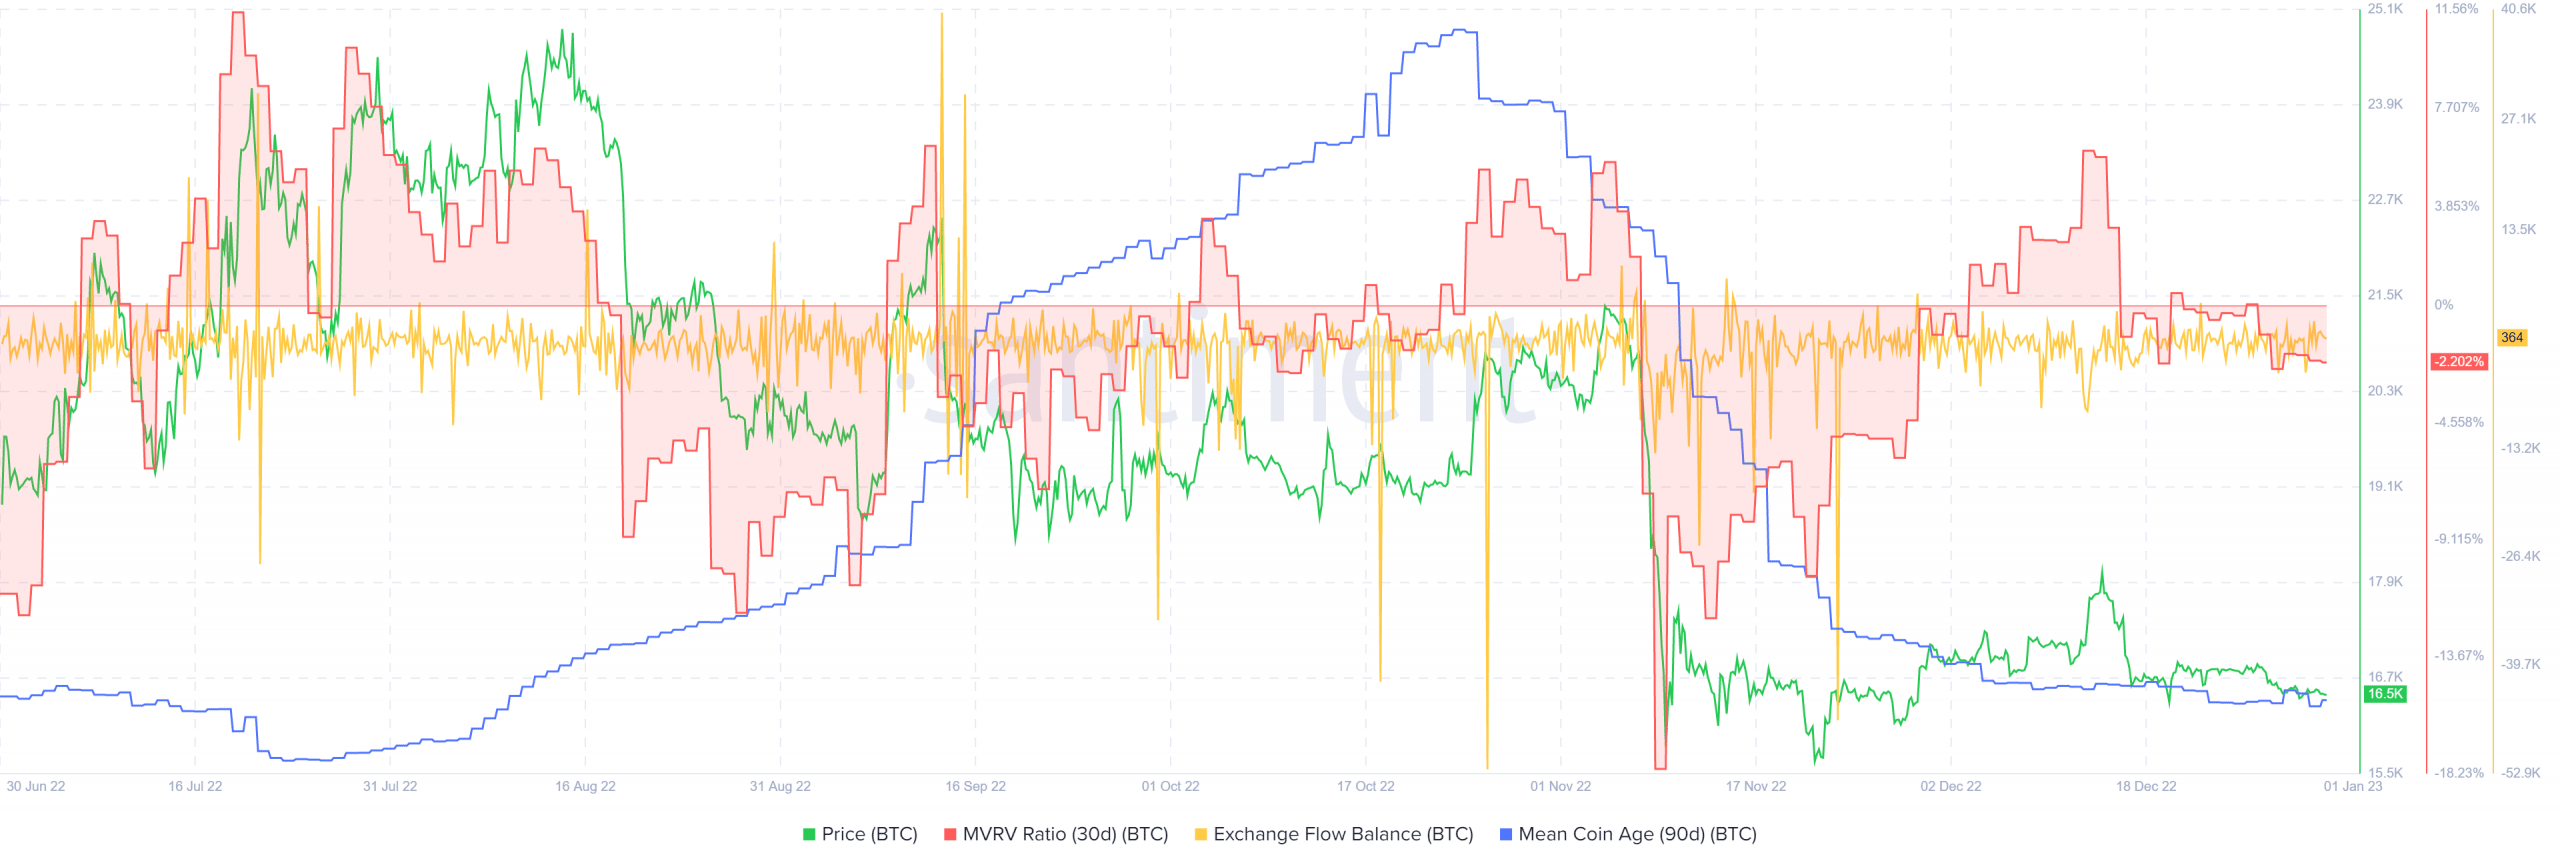
The 30-day Market Value to Realized Value (MVRV) ratio slipped into negative territory after the sharp rejection BTC faced at $18.4k. This rejection saw the asset slump back below $17k and indicated it was slightly undervalued according to the metric.
The 90-day mean coin age has also been falling since November to show the increased movement of the coin between addresses, and alongside the price action, it likely stemmed from selling pressure.
Are your BTC holdings flashing green? Check the Profit Calculator
The exchange flow did not show significant amounts of BTC flowing into or out of exchanges in December. Furthermore, a massive inflow could presage a large drop in prices and be worth watching out for.