Bitcoin SV, NEM, Maker Price Analysis: 09 February

Despite market leaders Bitcoin and Ethereum valued at historical levels at the time of writing, altcoins such as NEM and Maker moved on their own accord, while trading in the red zone. On the contrary, BSV rose on the back of bullish cues from the broader market, but it remained uncertain whether it would be able to go past its previous local high.
Bitcoin SV [BSV]
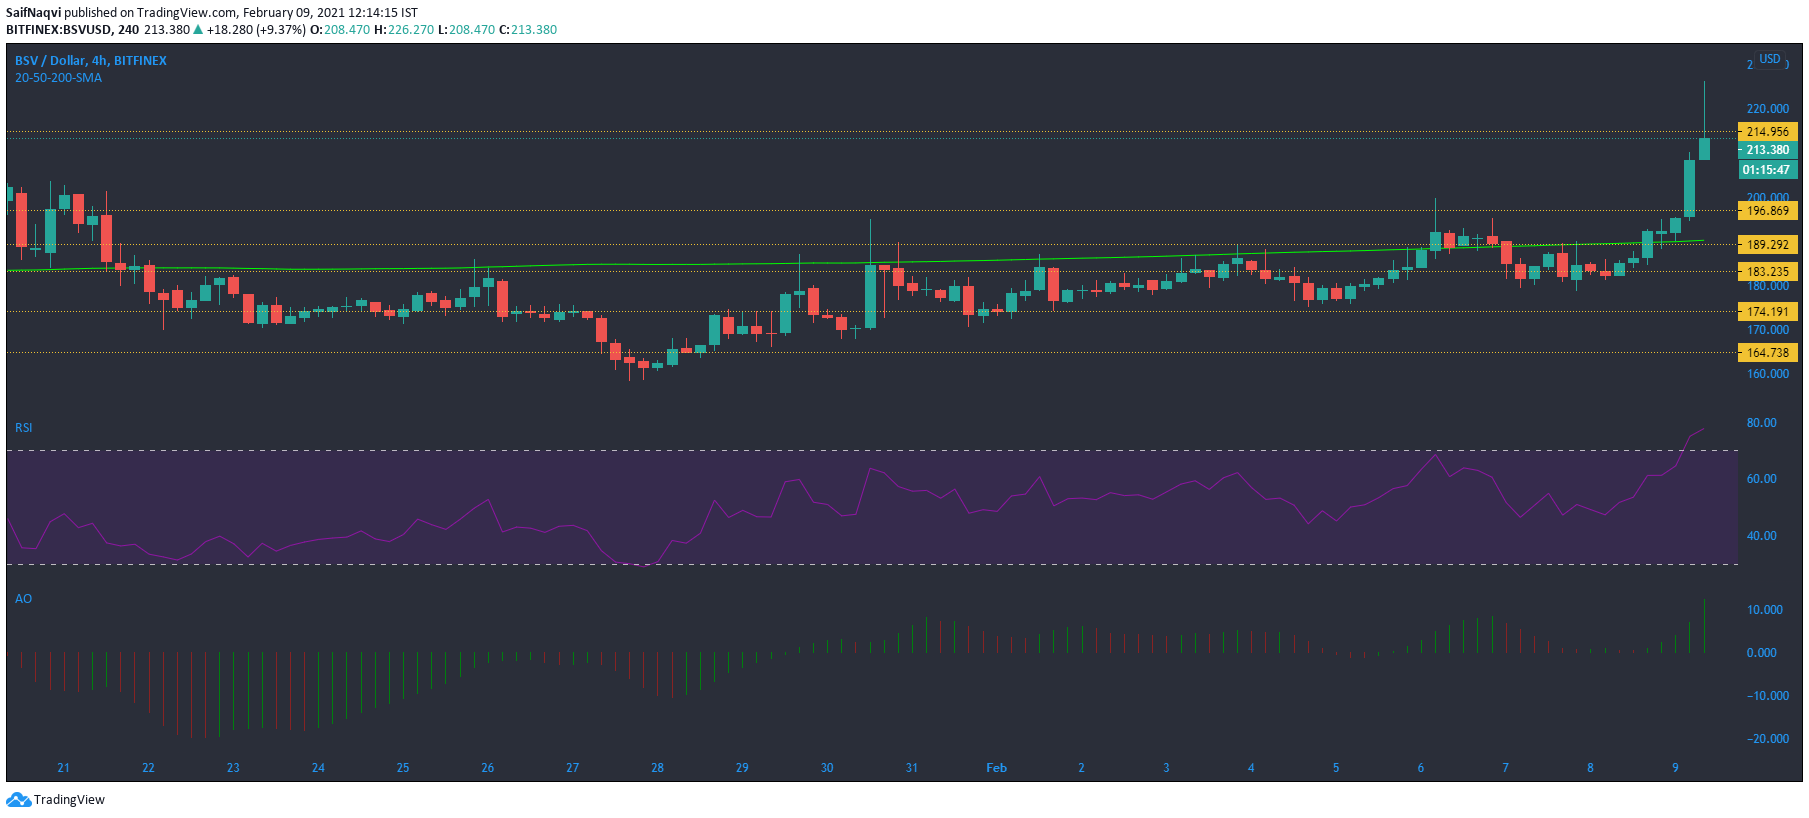
Bitcoin SV climbed above its 200-SMA (green) on the back of a broader crypto-rally, with BSV being traded at $214, at press time. What remains to be seen, however, is if BSV can topple its local high of $290, a level that was snapped during the previous Bitcoin rally in January. The Awesome Oscillator noted rising momentum on the bullish side as the green bars rose in length above the half-way mark.
Finally, the Relative Strength Index moved north into the overbought zone, with a bearish pullback seemingly delayed. Although the indicators flashed bullish signals, trading volumes and buying activity would need to be on the higher side over the next few sessions if BSV wishes to rise above its previous local high. In the event of a correction, areas of support resided at $196.7 and $189.2.
NEM [XEM]

NEM was unable to flip the stubborn resistance level at $0.33, even after the recent bout of buying activity. In fact, the bullish momentum seemed to be waning in the market as the green bars on MACD’s histogram decreased in length despite a bullish crossover. The Chaikin Money Flow remained well below the half-line, signifying a lack of capital inflows for NEM.
In case of a fall, support can be provided at $0.283 and $0.266. On the other hand, further strength in the broader market could push XEM north of its upper ceiling.
Maker [MKR]
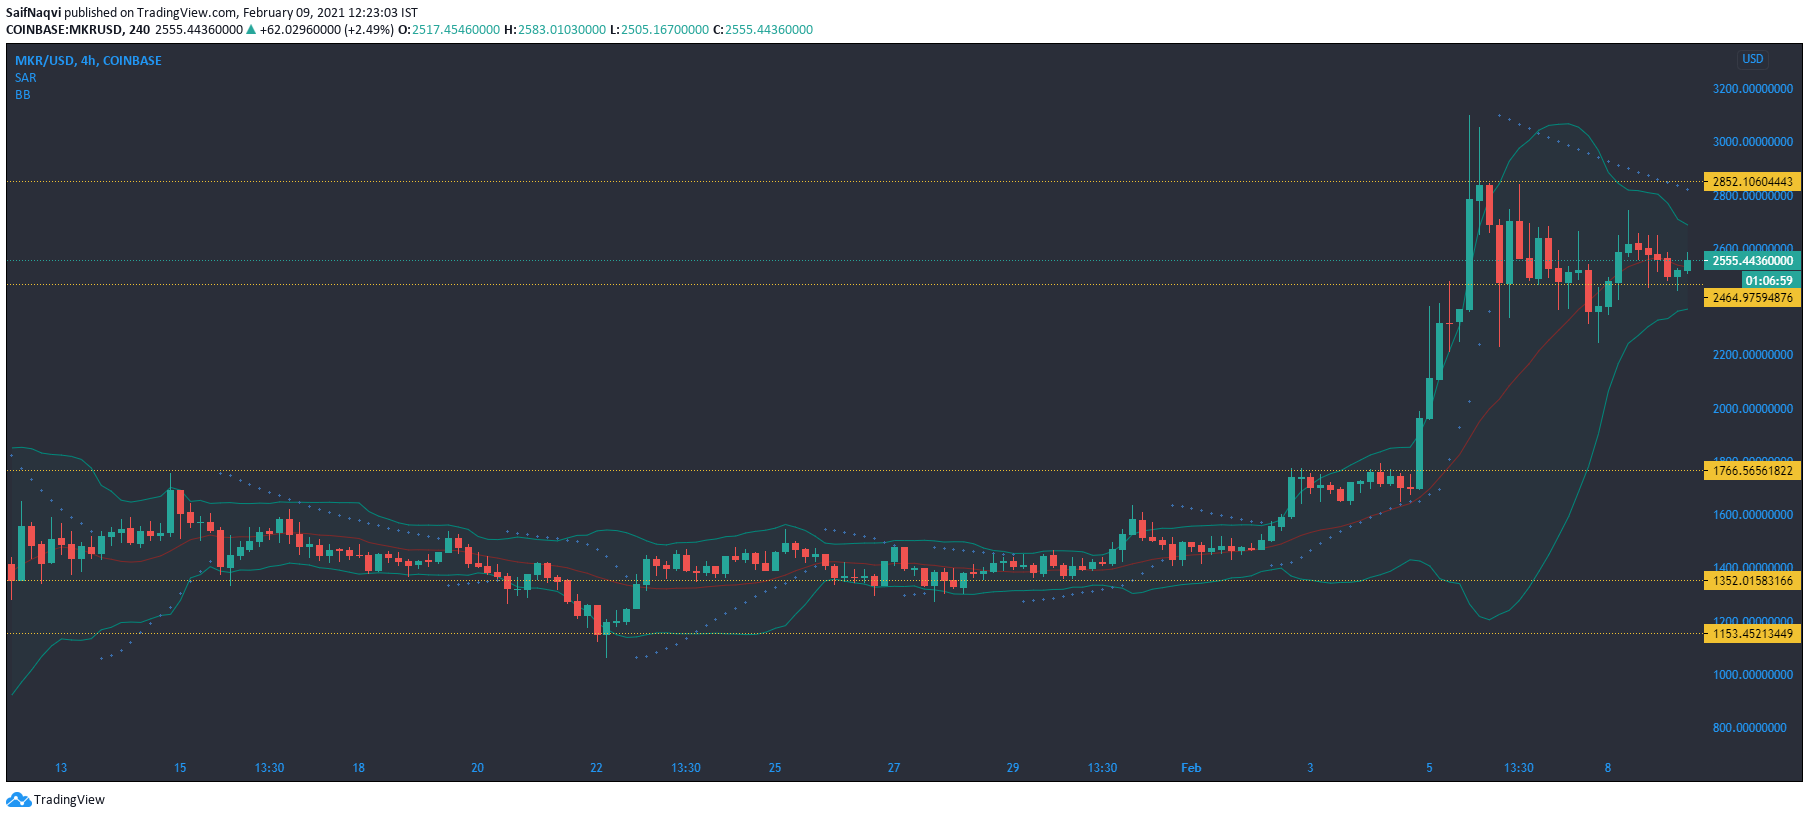
Maker was trading in the red, at press time, with the 24-hour trading volumes and buying activities very muted. The Parabolic SAR’s dotted markers moved above the candlesticks and marked a downtrend since the cryptocurrency snapped its previous all-time high on the charts. The Bollinger Bands noted low volatility in the market as well. Despite a broader market rally, it was arduous to back a bullish move for MKR over the coming sessions.
In fact, a period of consolidation can be expected in the short term and traders are advised to hold on to their positions before a clear trend emerges.


