Bitcoin, THETA, VeChain Price Analysis: 20 June

The market continued to move sideways with the total market capitalization remaining under $1.5 trillion. Bitcoin kept above the $35,000 mark as it continued to move sideways. THETA did not make many gains, while VeChain continued to make headlines as it continues to lead the blockchain’s adoption in the food industry.
Bitcoin [BTC]:-
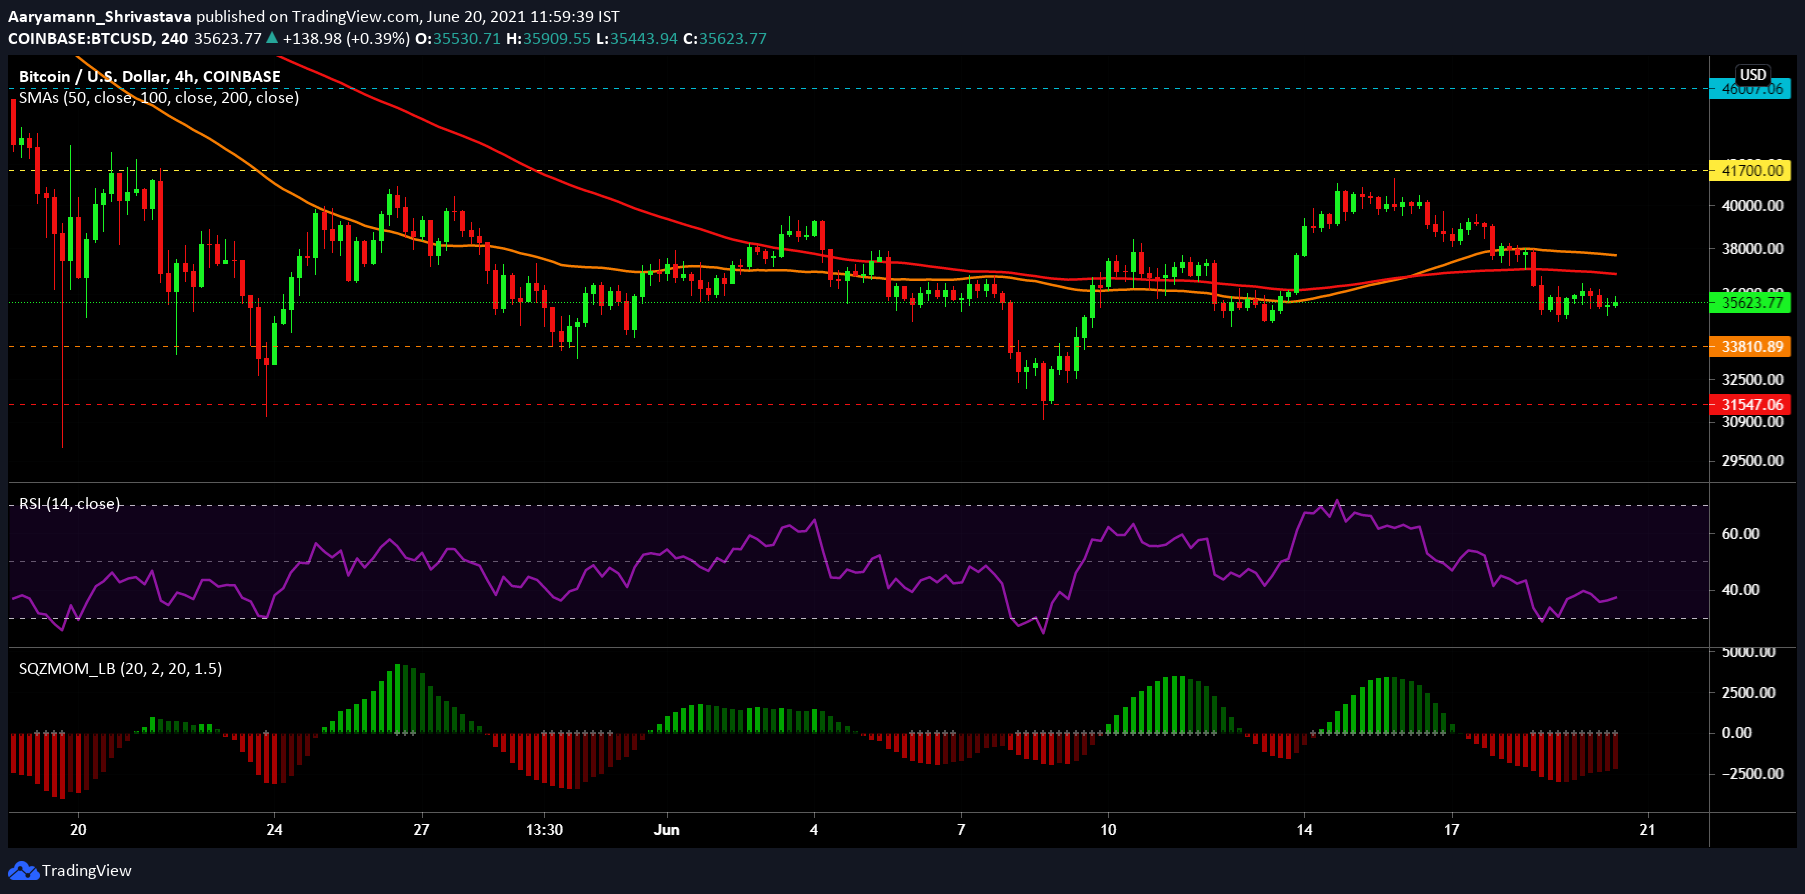
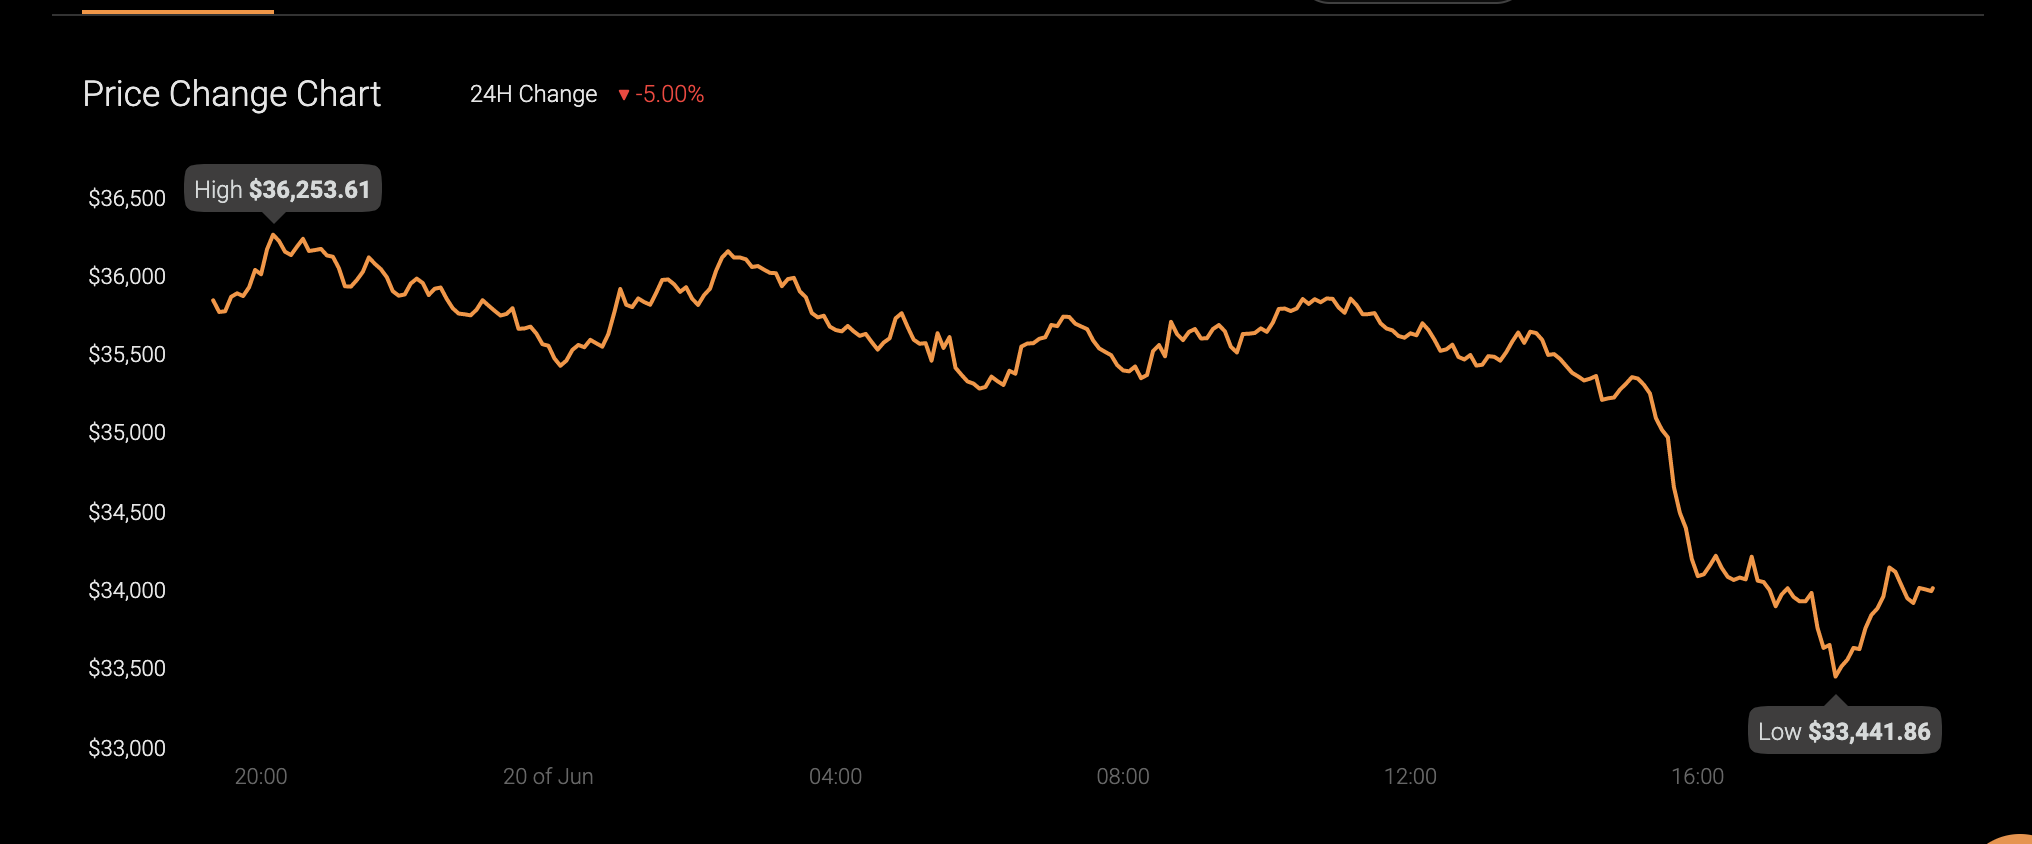
Bitcoin fell by 10.14% in the 24 hours of the June 17 dip. At the time of writing, the king coin displayed some sideways movement under $36,000. Despite the double-dip, the coin managed to save itself from falling any further towards the $33,810 support level. According to Squeeze Momentum Indicator, the coin was in an active squeeze release (white dots). Bearish pressure too could be seen going down due to the presence of dark red bars.
While Relative Strength Index (RSI) did move up from the oversold region, it continued to linger in the bearish territory at press time. Simple Moving Averages line – 50 SMA (red) and 100 SMA (orange) acted strongly bearish and remained above the candlesticks.
As the coin maintains a sideways movement at the moment, the price could swing either way, but it’s important for BTC to keep above the support line in order to initiate a bull run.
THETA:-
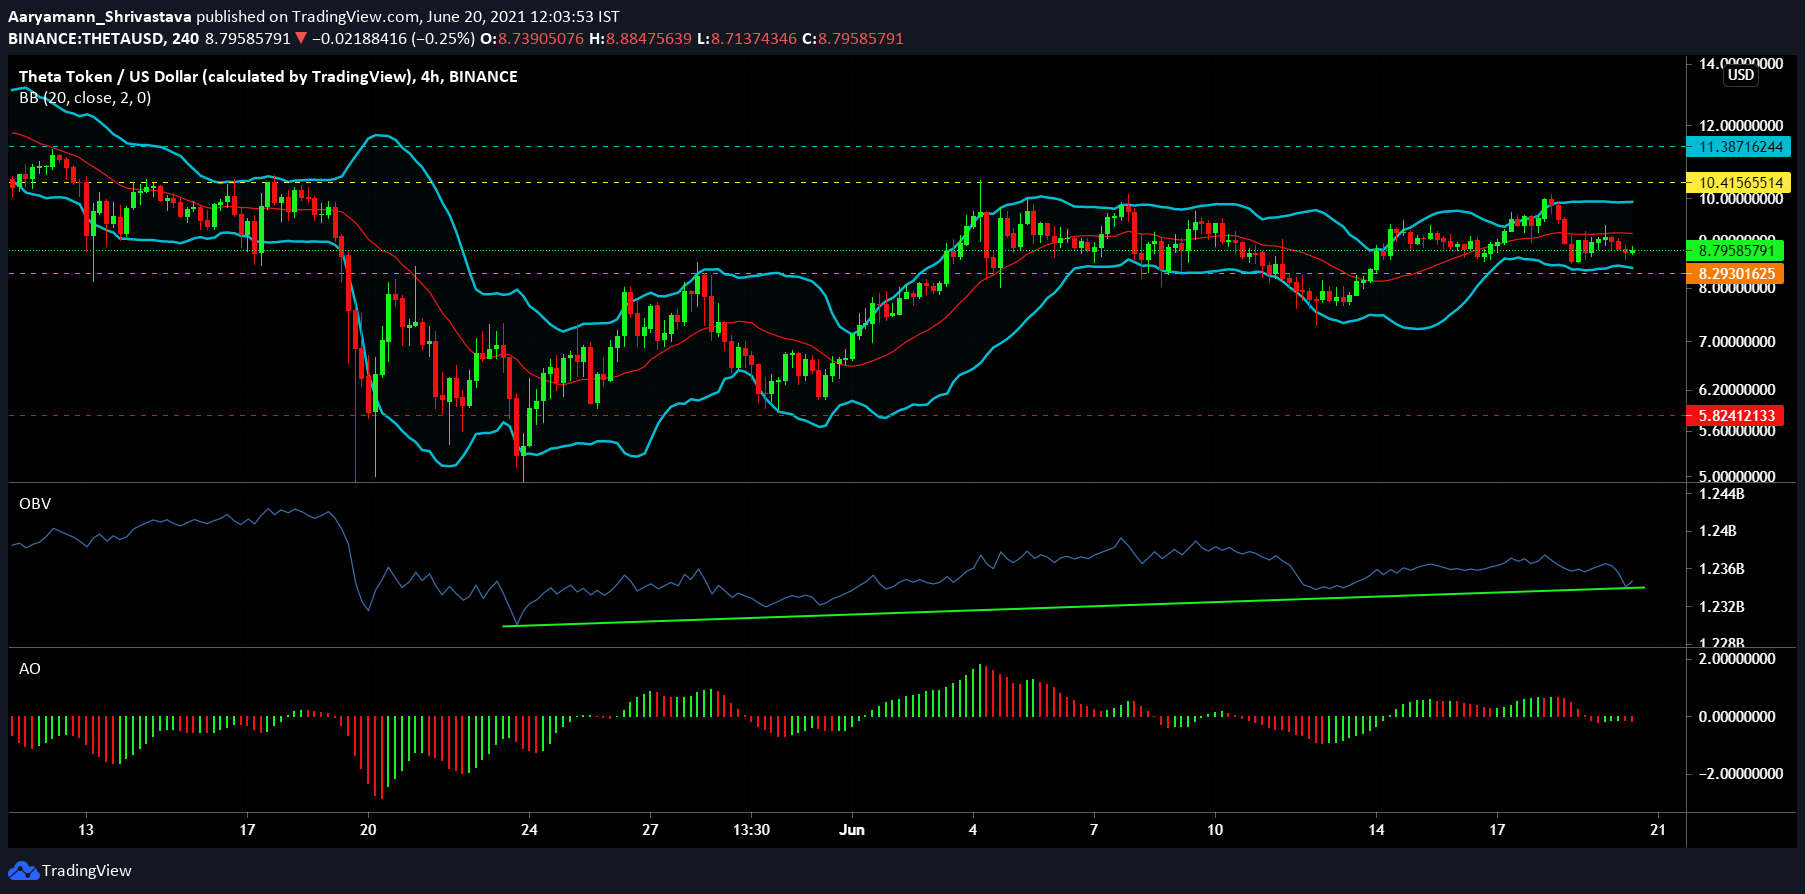
THETA has kept itself consolidated between $10.41 resistance and $8.29 support level since June 4 with a dip between June 12 and 14. At press time, it traded at $8.79, registering a slight fall earlier in the day. Bollinger Bands continued to move parallel with the basis (red line) acting as resistance.
On Balance Volume had been rising consistently since May 26, even though a minor dip could be seen on the indicator followed by an uptick at the moment. Awesome Oscillator indicated bearish momentum creeping in at the time of writing due to the presence of red bars.
The active support level is a key level moving forward.
VeChain [ VET ]:-
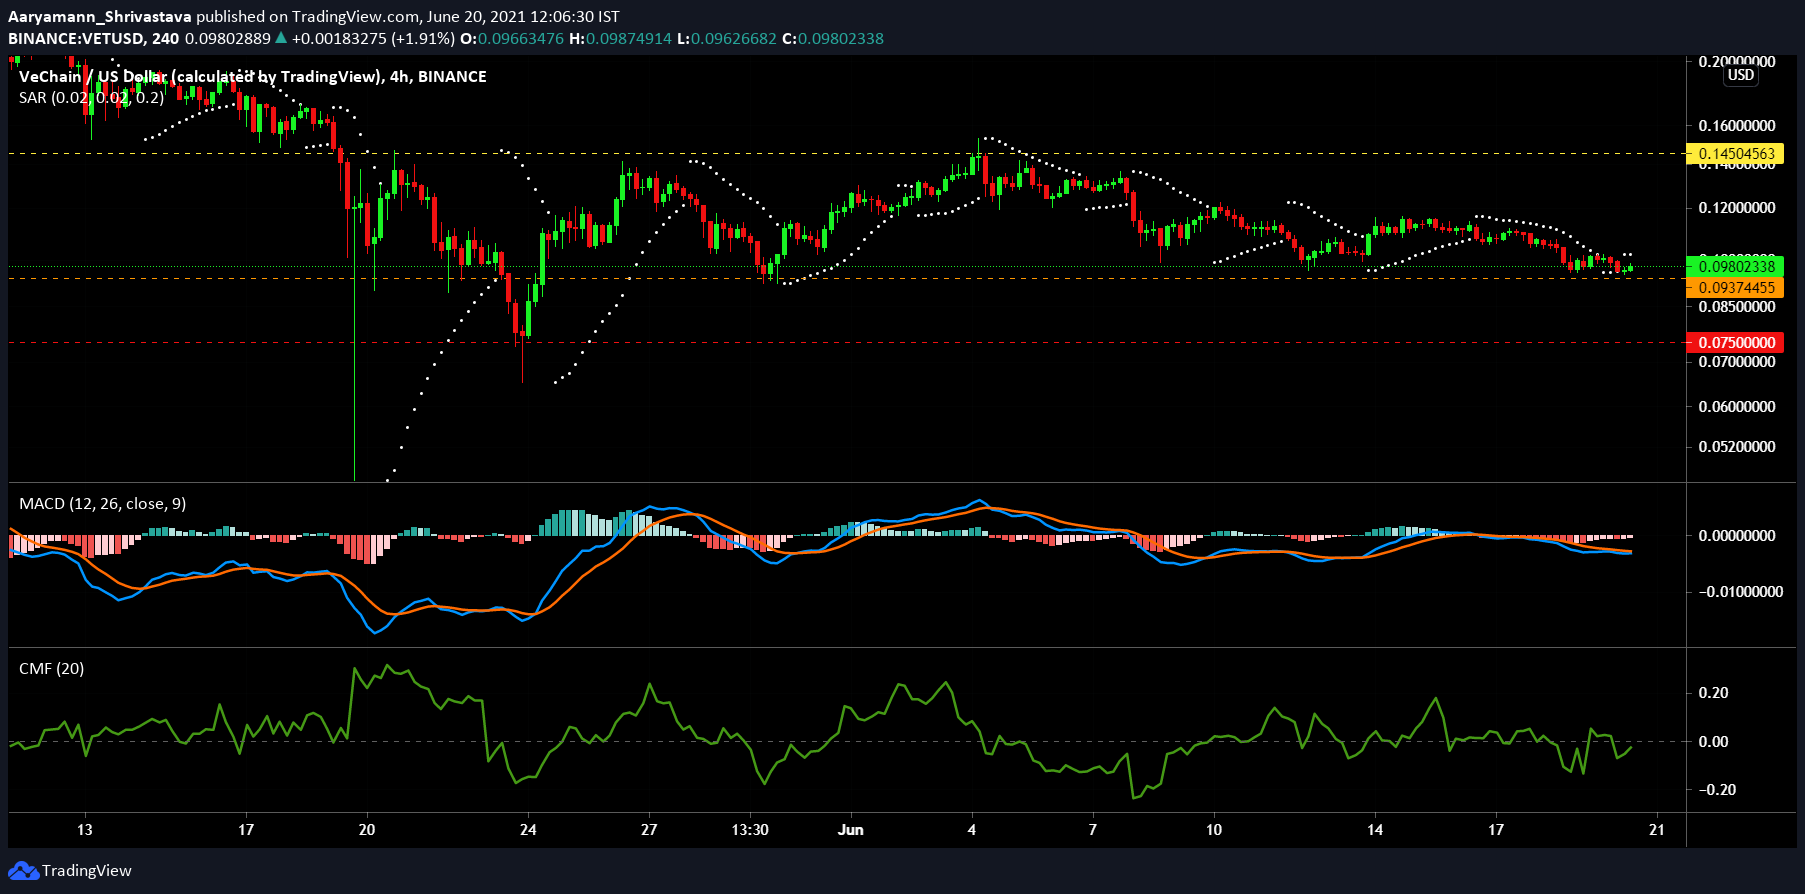
VET is yet to breach its resistance level ($0.145) but the coin has tested its support level ($0.093) frequently in the last 2 weeks. Trading at $0.098, the coin moved close to $0.093. Parabolic SAR showed that a downtrend had been initiated at the time of writing due to the presence of the white dotted line above the candlesticks.
MACD continued to display a bearish crossover as the red signal line remained above the blue indicator line. Despite the dip under the neutral line, active capital inflows brought the Chaikin Money Flow indicator back up close to the 0 mark in the bearish neutral territory.
The coin could probably move further downward based on the indicators, which would establish $0.075 as the next support level.


