Bitcoin, Tron, Terra Price Analysis: 28 November

The sustained bearish rally led several altcoins to mark their multi-week lows during the past few days. Consequently, Bitcoin hit its seven-week low on 26 November, while Tron touched its one-month low on 27 November.
On the other hand, Terra marked a bull rally over the last day after displaying bullish technical indications.
Bitcoin (BTC)
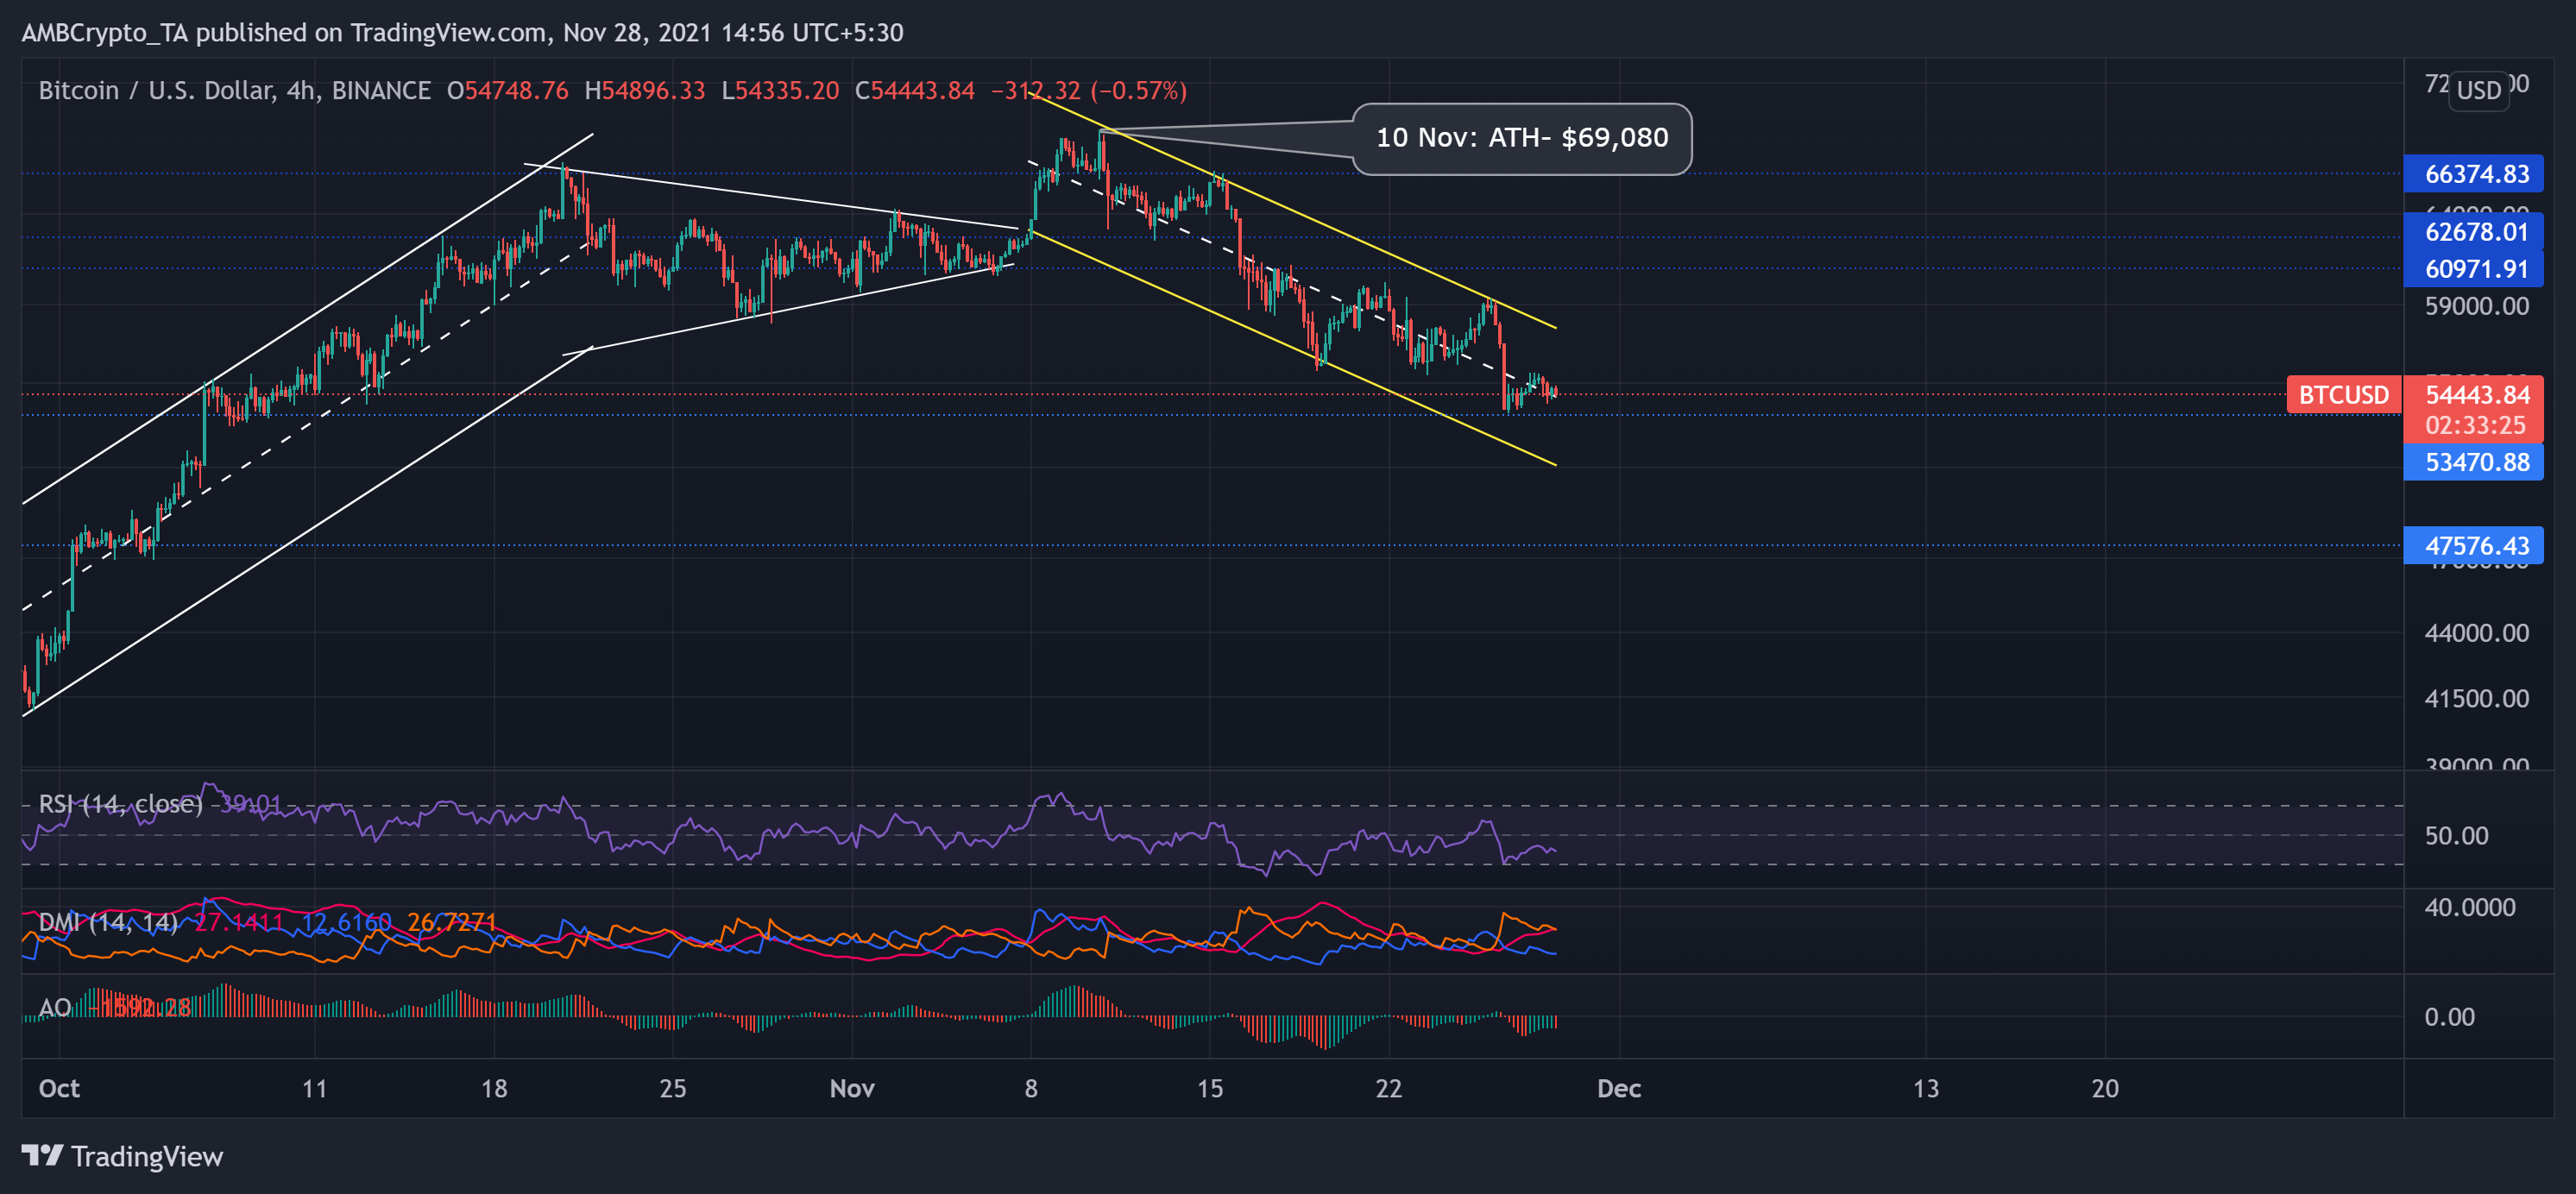
From 21 July, the king coin has managed to mark higher lows to date. Since late September, BTC moved between an up-channel (parallel, white) that transposed into a bullish pennant pattern. The largest crypto registered a staggering 66.53% ROI from 30 September to 10 November. After a bullish pennant breakout, the price hits its ATH on 10 November at $69,080.
Since then, however, BTC consistently fell in a down-channel (parallel, yellow). With a sustained sell-off, the bears triggered a 22.3% downturn (from 10 November) as the price hit its seven-week low on 26 November.
Now, it becomes crucial for the bulls to hold the $53,400-mark (immediate support) to stop a significant plummet towards the $47,500-mark. At press time, BTC traded at $54,443.84. The RSI showed no revival signs and seemed to point south. Further, the DMI and AO confirmed the bearish vigor.
Tron (TRX)
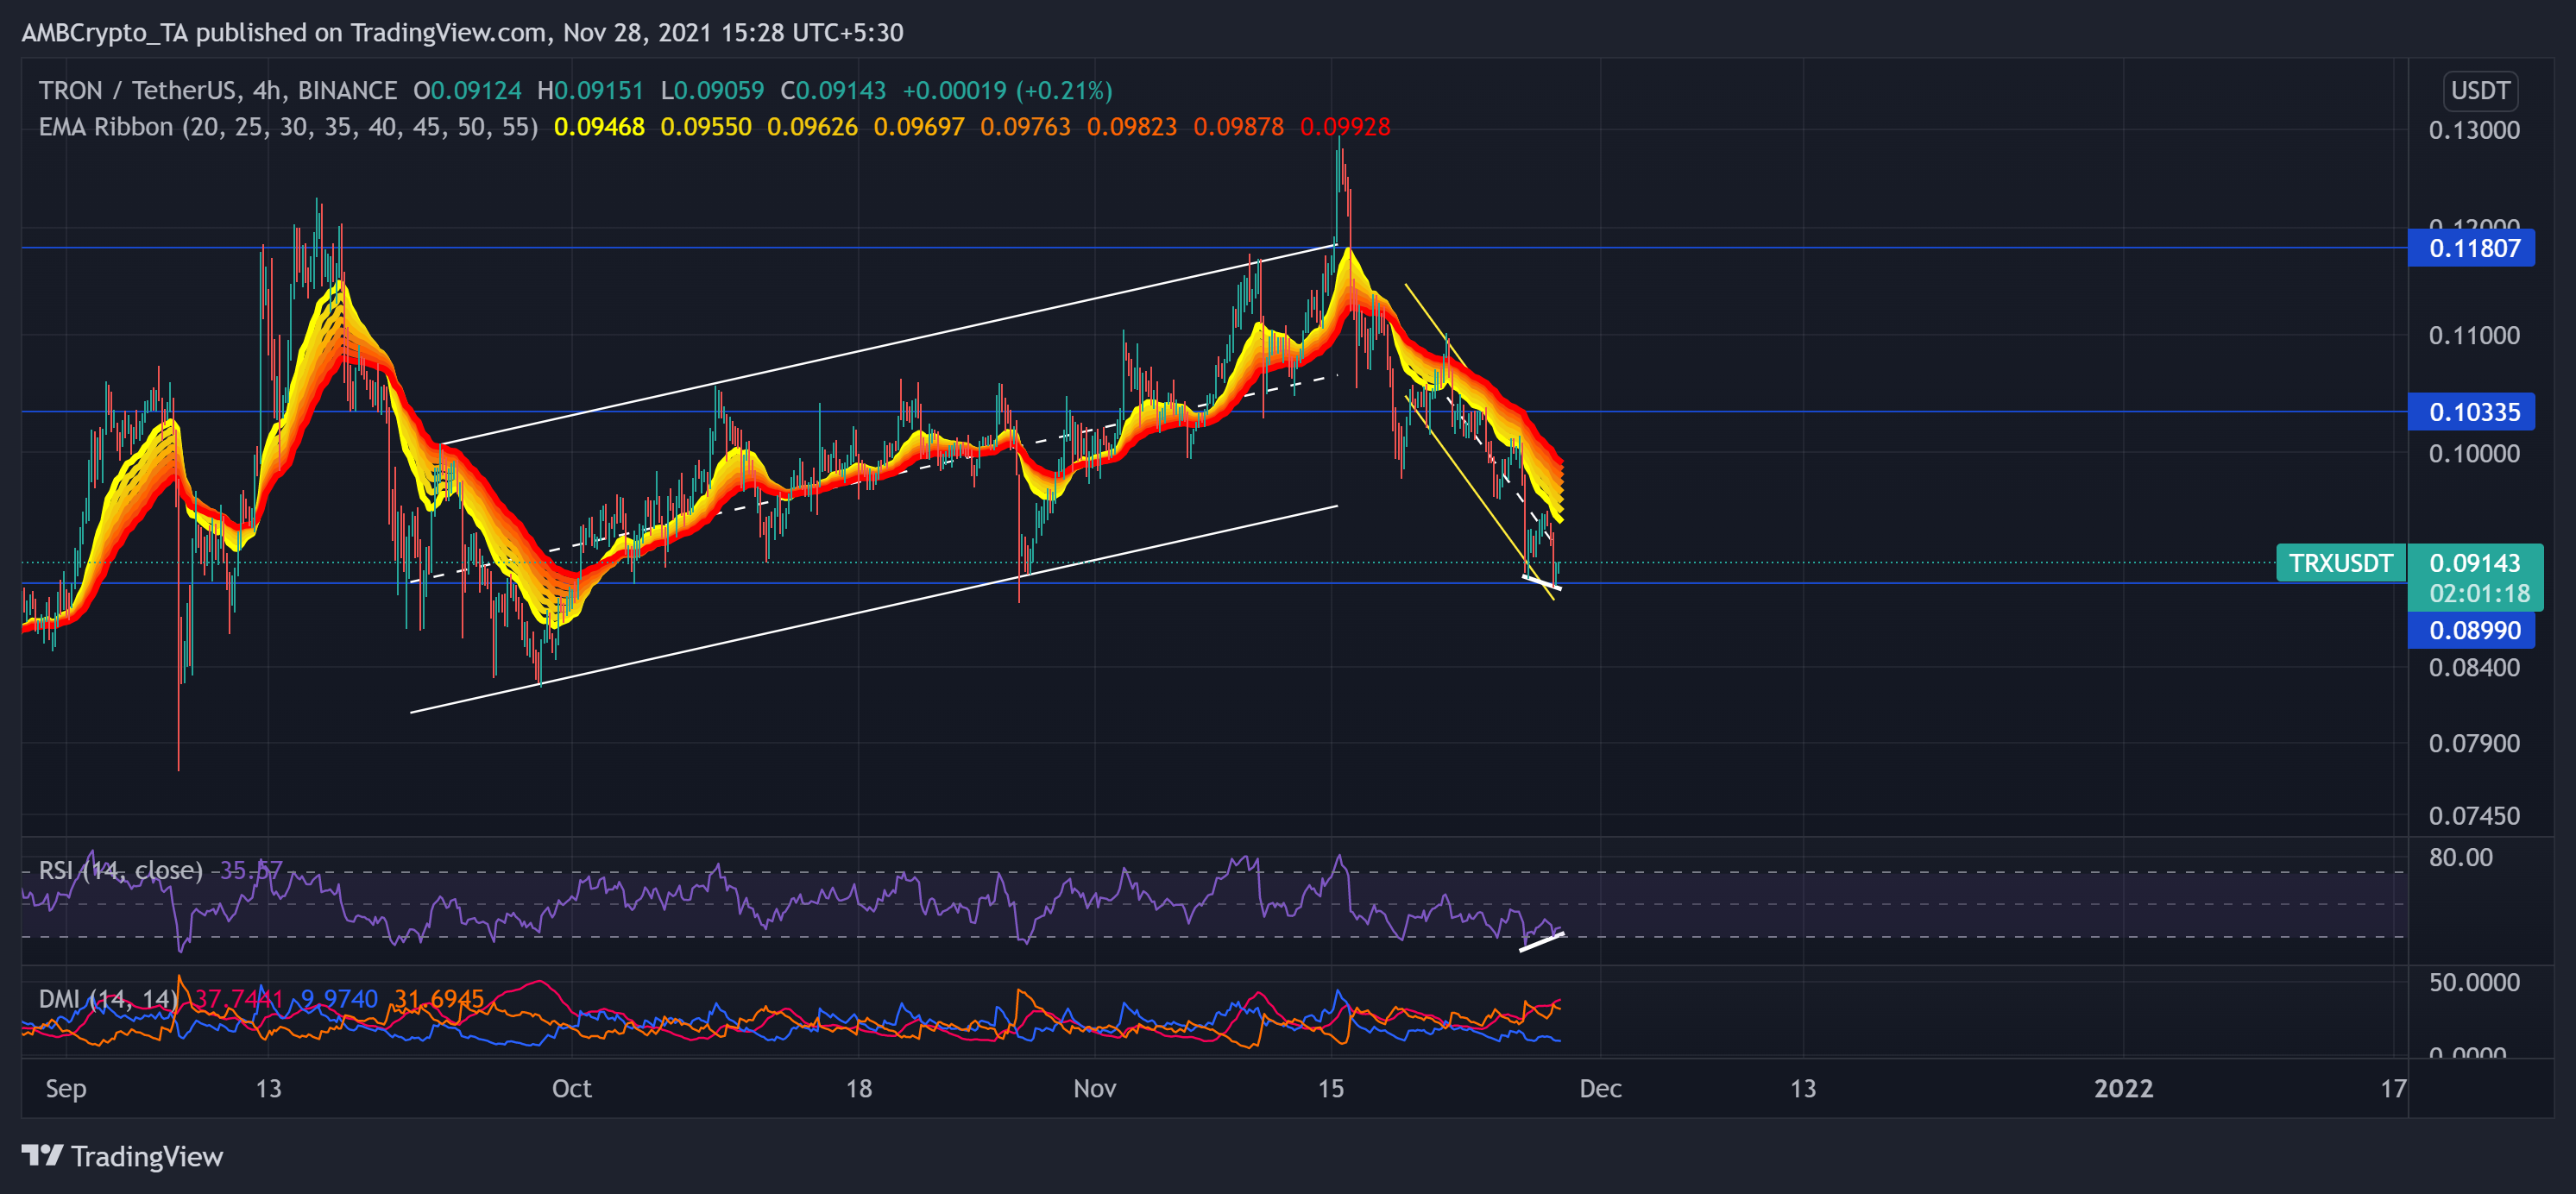
From 29 September, the alt recorded an over 54% 47-day ROI. Thus, the rally triggered the price to its six-month high on 15 November.
However, the bears showed resistance at the $0.11-mark for the past six months. As a result, the price moved back into the trend after noting an over 30.2% 12-day decline to poke its one-month low on 27 November.
This fall visibly pushed the price below all the EMA ribbons, depicting a powerful bearish influence. Now, the bulls will have to ensure support at the $0.089-mark to prevent a further breakdown.
At press time, TRX traded at $0.09143. The RSI attempted a revival but could not cross the half-line. However, a bullish divergence (white trendline) between the RSI and the price action could bolster a near-term bullish comeback. Also, the DMI skewed in favor of the bears along with a high directional trend.
Terra (LUNA)
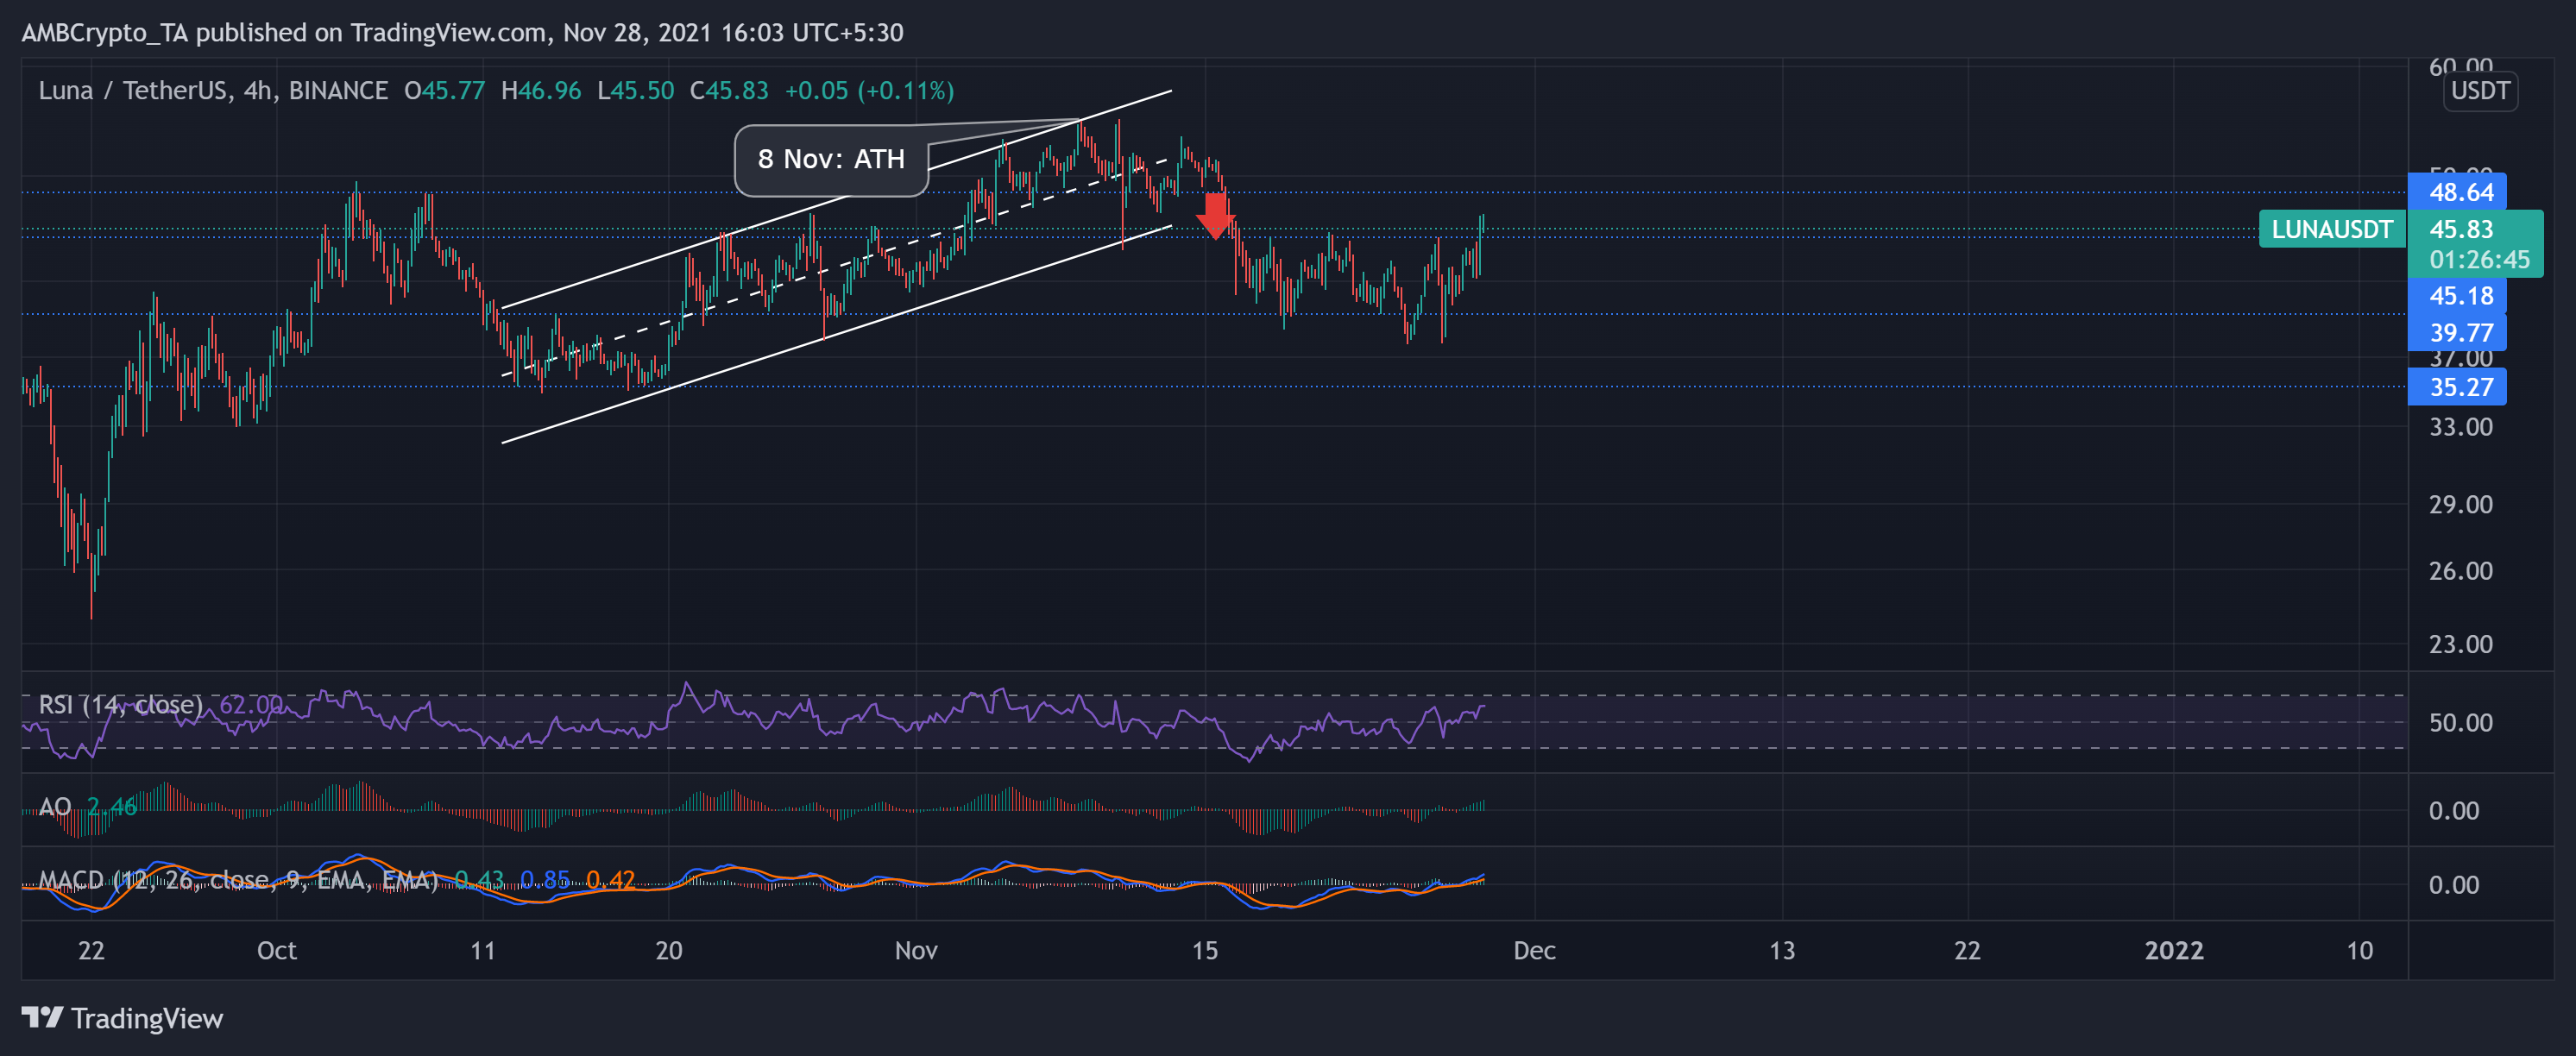
Since 19 October, LUNA price action undertook a bullish trajectory as the price bounced between the two parallel lines heading north. The digital currency noted a monstrous 53.44% ROI from 19 October to 8 November.
Consequently, LUNA reached its ATH on 8 November and bounced back from the upper trendline. Since then, correlating with market inclinations, the alt lost over a third of its value until it touched its five-week low on 24 November.
However, the altcoin saw an 8.7% incline in 24 hours. Thus, bulls ensured to breach the $45.1-mark. If they continue their rally, they could find strong support at this mark. At press time, LUNA traded at $45.83. The RSI was northbound after favoring the buyers. Further, MACD and AO confirmed the RSI’s conclusion.