Bitcoin’s current demand, profit levels have cues for optimal BTC allocation

Bitcoin has been gradually raising its floor price and is trading at a premium compared to its 2022 lows. However, its $41,861 price tag at the time of writing is roughly 40% less than its historic ATH, and anyone who purchased the cryptocurrency above its current price is still at a loss.
If you are among those who are not yet in profit, chances are that you have found yourself wishing you would have waited for the price to drop. However, perfectly timing the market is next to impossible. The good news is that Bitcoin is currently flashing signs of some upside.
BTC’s April retracement provided yet another healthy discount but its price action recently encountered its ascending support line. Bitcoin’s price registered significant sideways action in the last few days as strong accumulation challenged the selling pressure.

The above chart highlights BTC’s price range restricted by support and resistance. It also shows that BTC failed to secure enough demand to maintain strong bullish momentum above $47,000. Meanwhile, heavy accumulation has been taking place below $39,000.
Although BTC’s price chart provides a rough idea of its healthy range, on-chain metrics present a better picture of the level of demand within a specific price range. This is especially important considering the rising price floor and the constantly changing market dynamics.
Making sense of Bitcoin’s position using on-chain metrics
A good example is Bitcoin’s futures open interest which shows the number of open derivative contracts. These contracts usually increase when the probability of upside increases. It explains why the metric has been on a steep decline since 7 April and registered an uptick on 18 April. However, this metric also accounts for short positions.
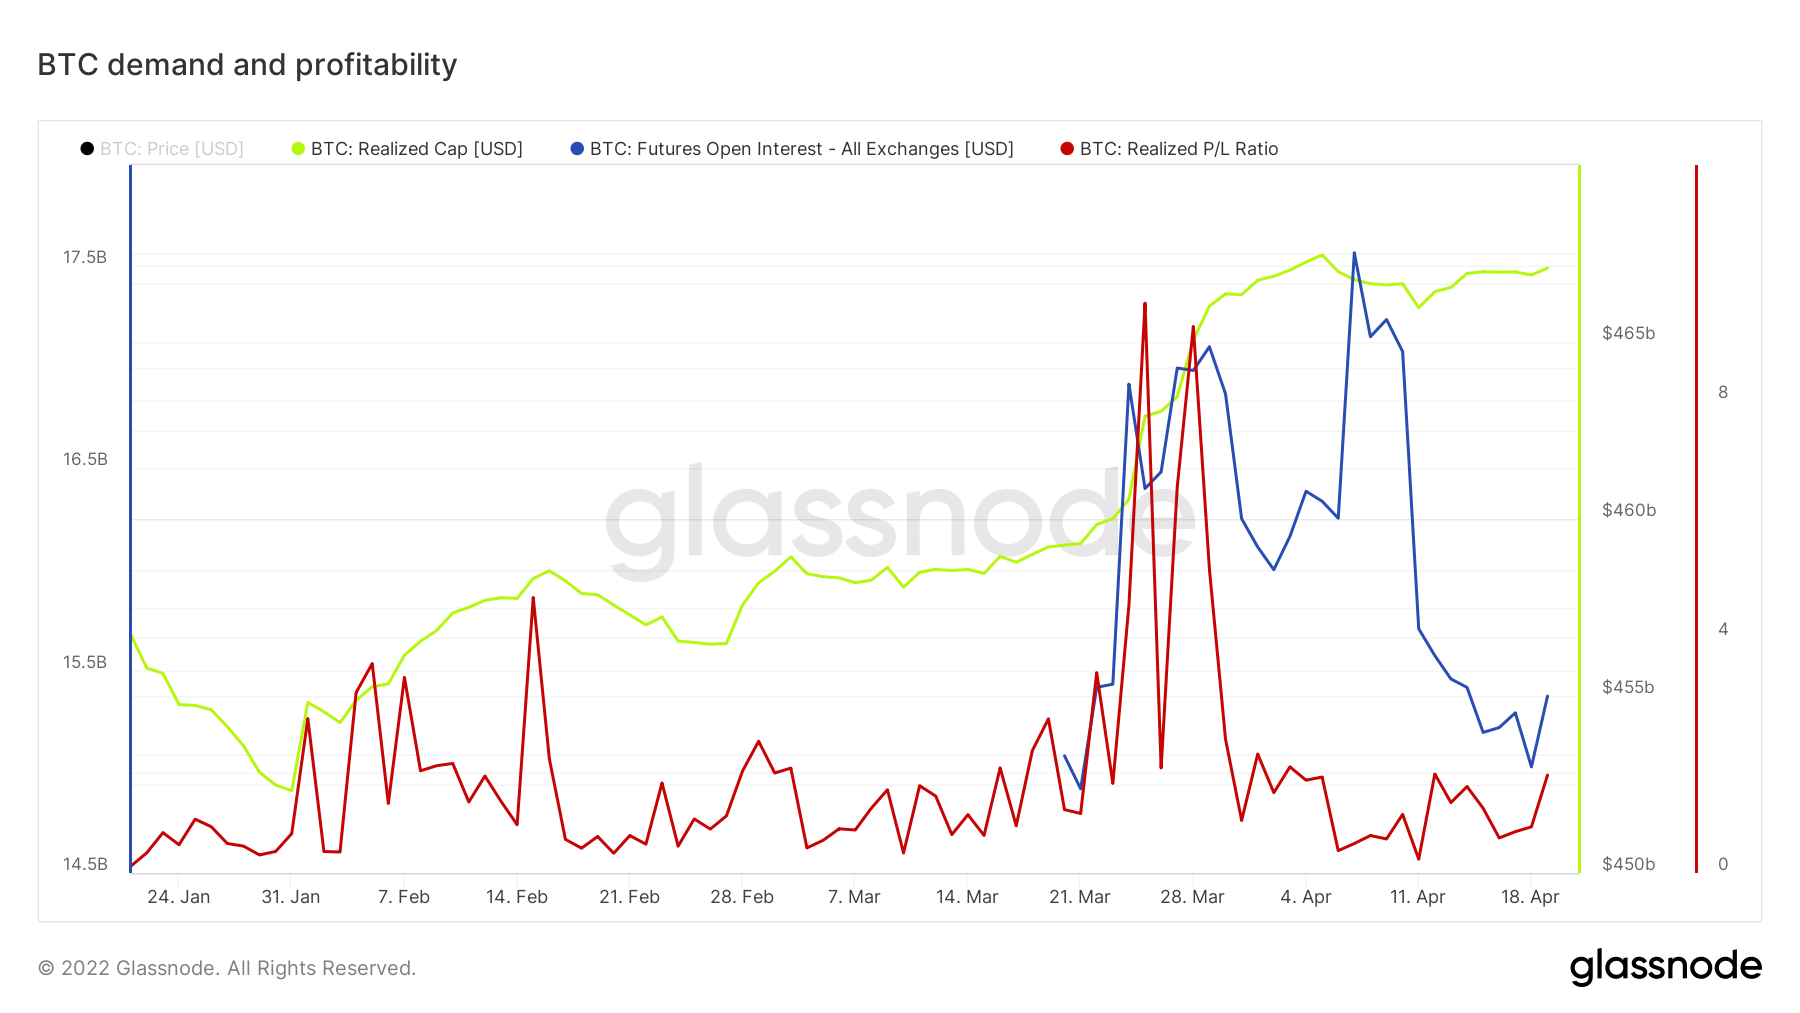
BTC’s realized P/L ratio does a better job of showing when Bitcoin is likely to rally or crash. This metric keeps a score of the level of profitability or loss by investors. A negative value highlights losses while a positive value highlights profits. The P/L ratio scored 1.65 at the time of this press, which means the number of traders in profit is still relatively low.
The realized capitalization metric shows the amount of realized value for all the Bitcoin in the network, taking into account the last time each coin was moved. This metric shows a significant increase in the last three months, meaning a lot of Bitcoin has been moved at lower prices.
The realized P/L ratio can be combined with the realized cap to make sense of BTC demand and profitability at any point. The probability of a bearish reversal increases when the P/L ratio rallies close to or above the realized cap. The probability of a rally increases when there is a strong divergence between the two metrics. Bitcoin’s current situation highlights divergence between the two metrics.