Polkadot: Estimating the probability of a pullback with tips for traders

Disclaimer: The findings of the following analysis are the sole opinions of the writer and should not be considered investment advice
Polkadot formed a rising wedge pattern, which generally sees the price drop toward the base of the pattern. This was on lower timeframe price charts, which meant that a pullback could be a decent buying opportunity. On the other hand, this bearish pattern could be invalidated with a strong push upwards by the price.
DOT- 1 Hour Chart
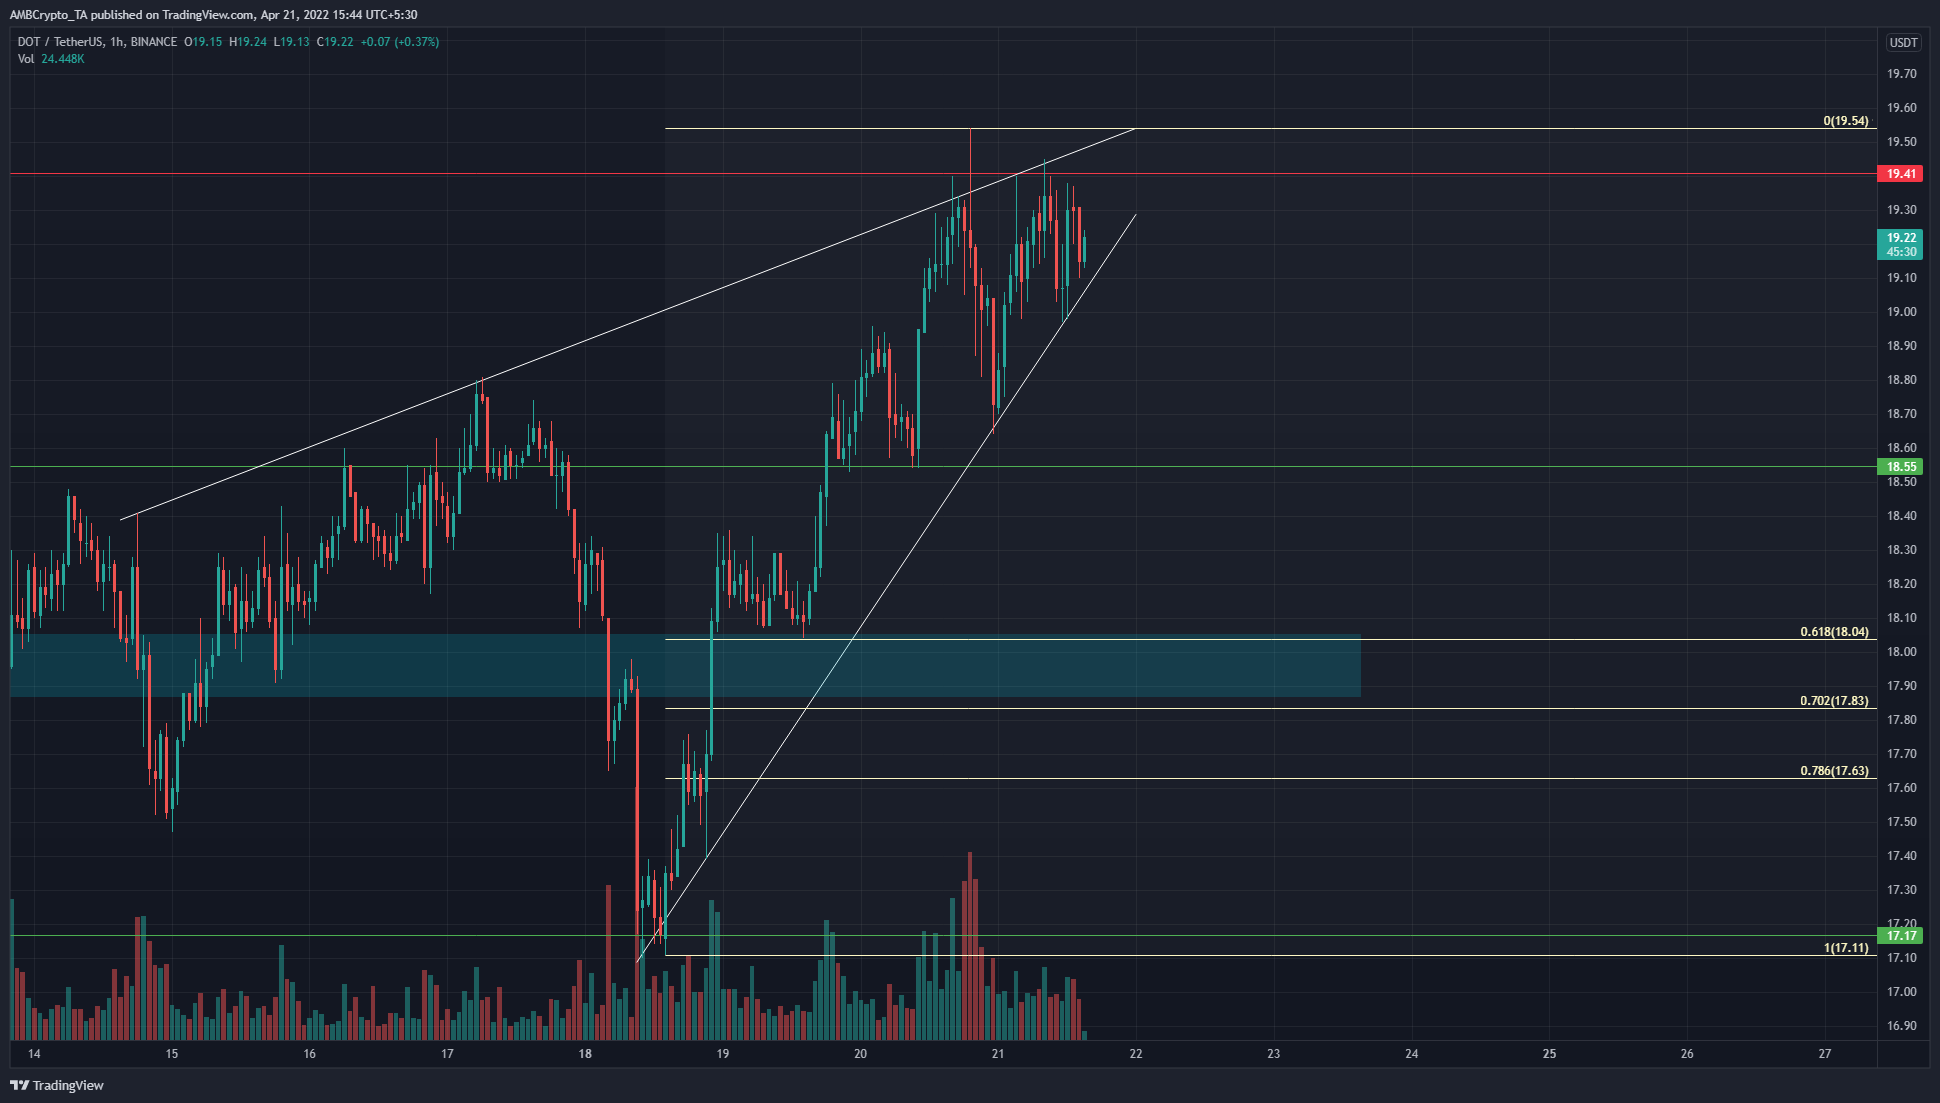
The $19.41 resistance level loomed large on lower timeframes for DOT. Moreover, the price formed a rising wedge pattern (white). This is a bearish reversal pattern that can see the price pullback while on an uptrend.
Based on the move from $17.11 to $19.54, a set of Fibonacci retracement levels (pale yellow) was plotted. At the same time, the $17.5-$18 area has acted as a zone of both supply and demand for DOT in the past week. This demarcated the cyan box as an area where bulls could take a stand.
On the other hand, the rising wedge pattern can be invalidated if DOT manages to flip the $19.41 resistance to support, and breaks out to the north of the pattern.
Rationale
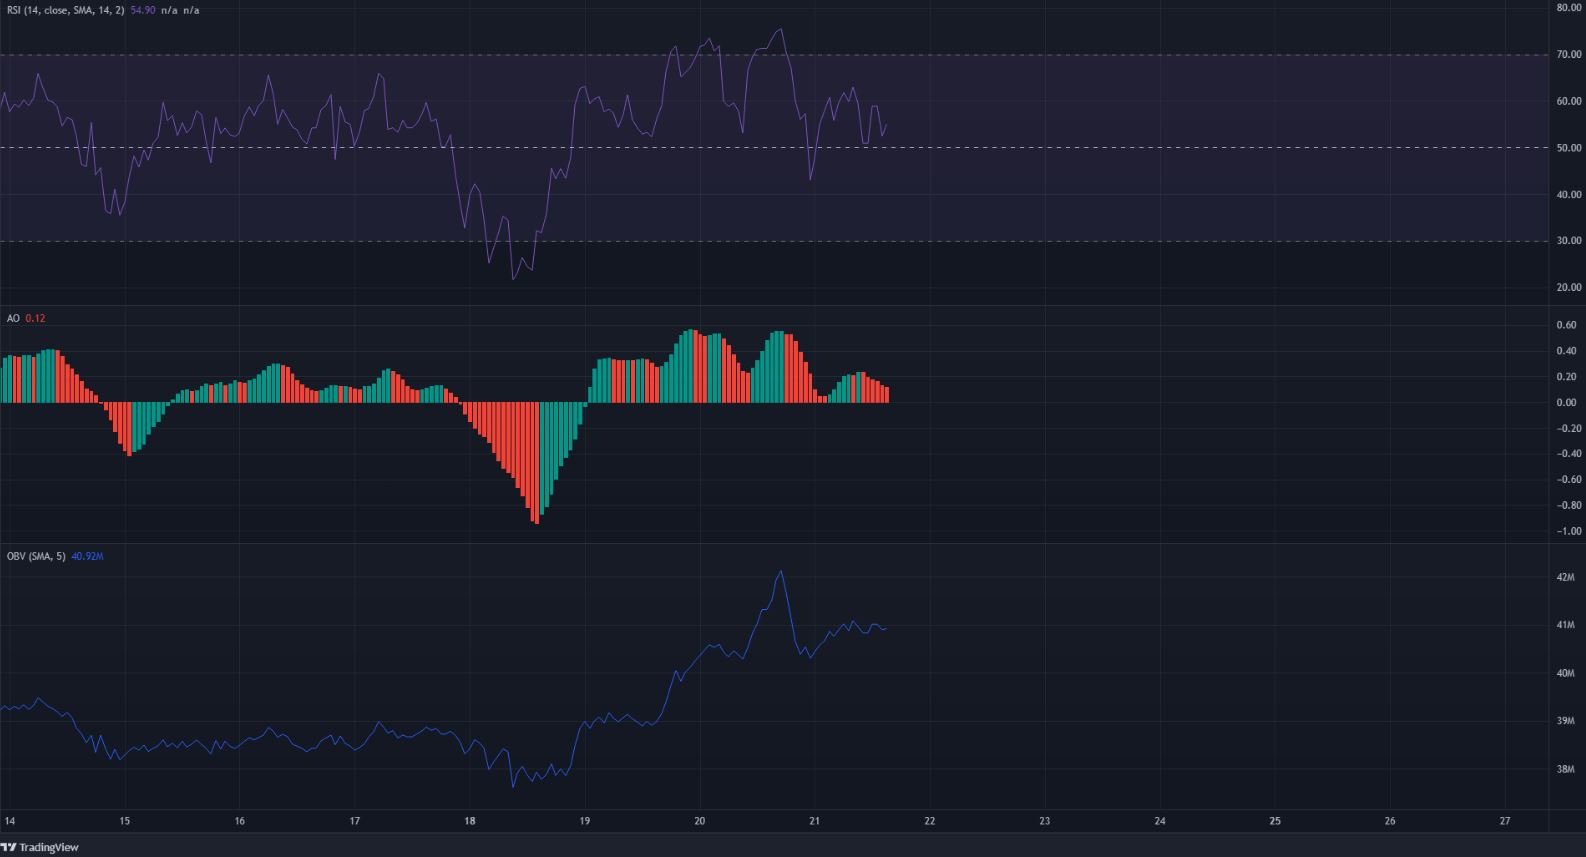
The RSI on the hourly chart dropped toward neutral 50 even as the price attempted to push past the $19.41 level. This suggested waning bullish momentum even as the bulls tried to drive prices further higher. It was a similar story on the Awesome Oscillator.
Even though the AO remained above the zero line, it showed waning bullish momentum.
The OBV did not see a large drop yet and has been on an uptrend during the price’s formation of the wedge pattern.
Conclusion
The $18 area can be a place where DOT would drop to in the next day or two, and the $17-$18 area could be used to enter long positions on a pullback. The wedge pattern can also be invalidated on a session close above the pattern.