
Bitcoin‘s price was trading at $35,500 after a correction of 7% in 24 hours, at press time. However, such a correction might just be the beginning of a much larger correction, one that might push BTC to $25,000.
Although a lot of investors are in disbelief about the bull run and are expecting it to continue, it might take a while for this rally to continue. After all, there hasn’t been a correction in a while. With Bitcoin consolidating on the charts right now, it could head either way.
Bitcoin price fractal
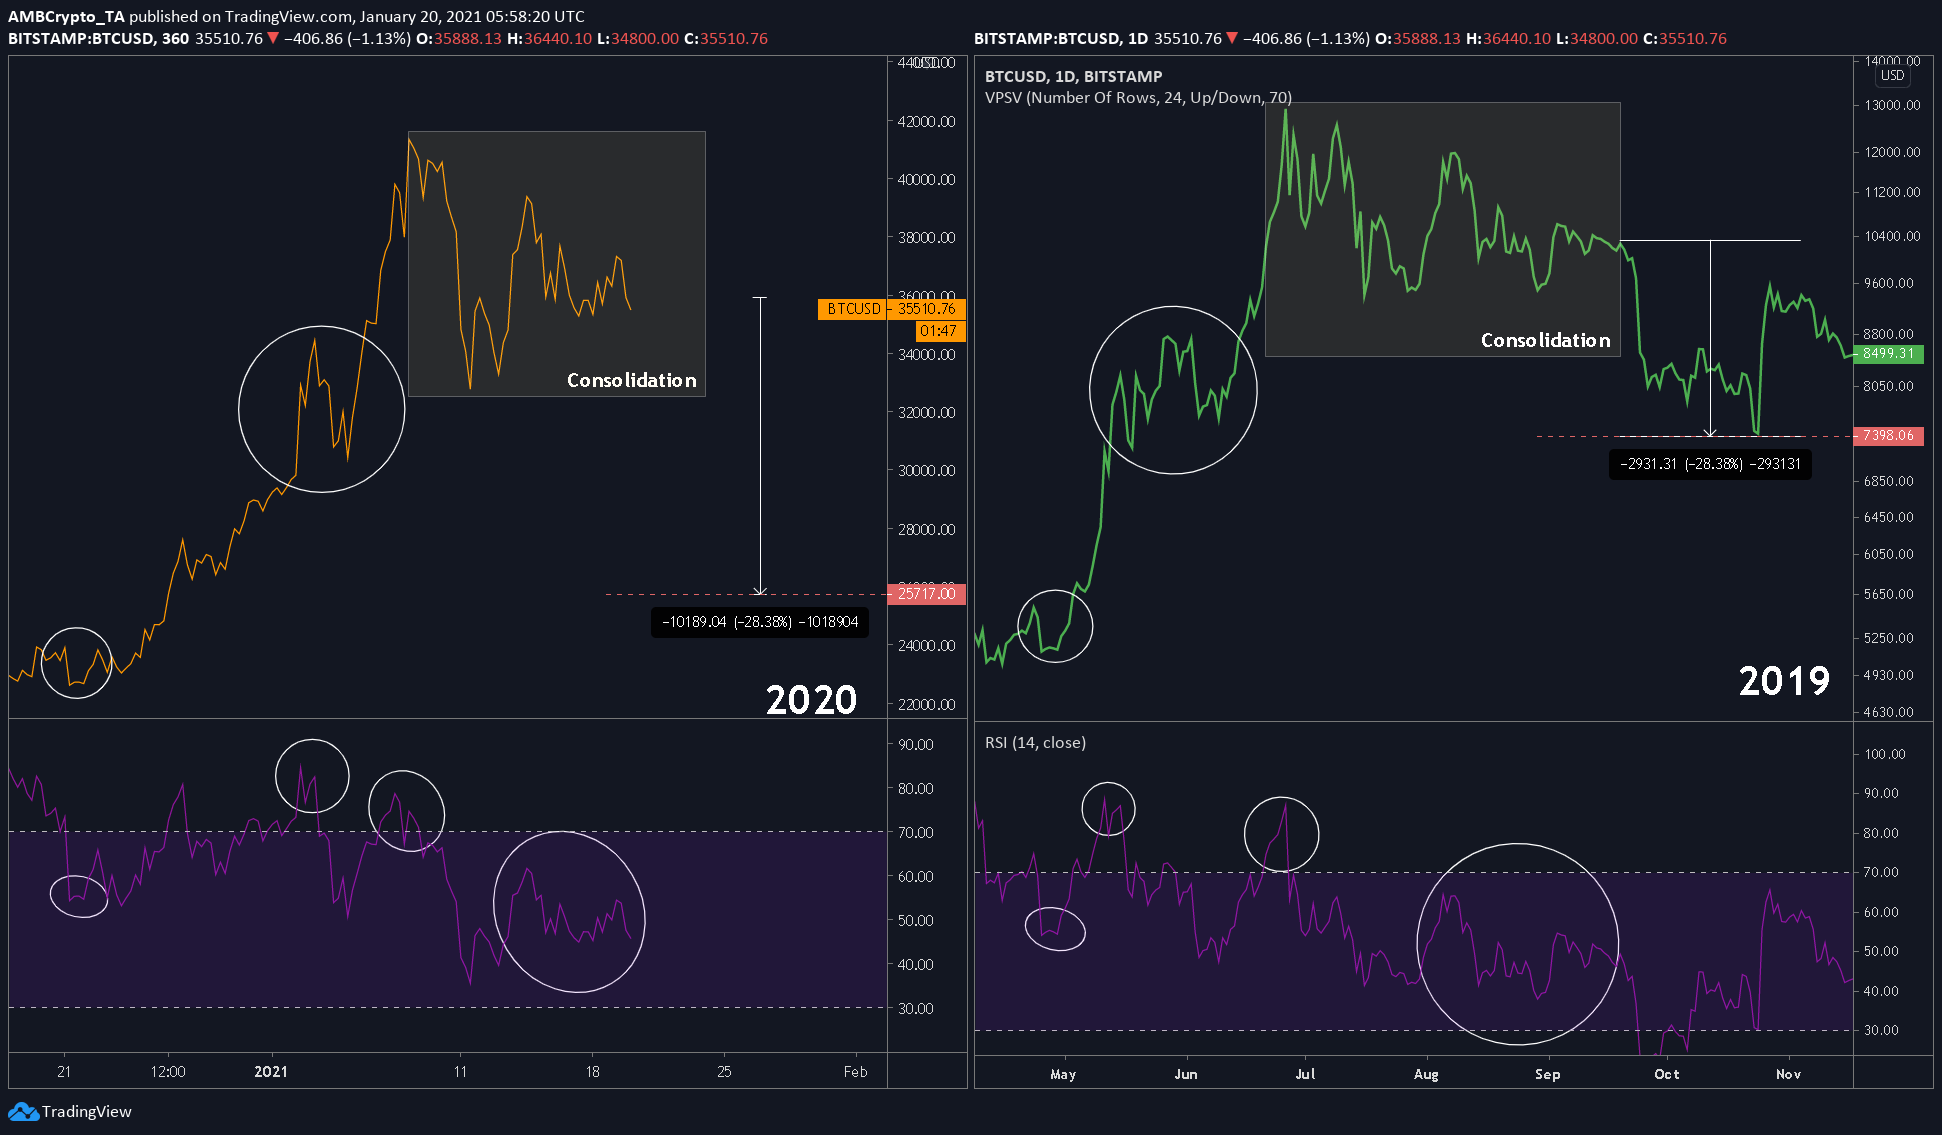
The attached chart compared Bitcoin tops, the current ATH at $42,000, and the one seen in June 2019. The new ATH hasn’t been compared to the 2017 ATH since Bitcoin wasn’t consolidating after hitting a top in 2017. In fact, it started retracing.
Source: BTCUSD on TradingView
So, as mentioned earlier, this consolidation could make or break the new bull cycle. At first glance, the consolidation seems harmless, a simple continuation pattern, a bullish pennant that clearly points to a bullish breakout. However, after a closer look, it can be seen that this pattern is an exact replica of the one that transpired after the local top in June 2019.
The circled parts represent the similarities seen in the price movements of 2021 and 2019. Further, the same applies to the RSI Indicator as well, with the same showing 3 distinct lower highs.
Based on these findings, the likelihood of a Bitcoin crash becomes more apparent as patterns tend to repeat themselves during times of over-optimism/pessimism, and right now, investors are overwhelmed with their returns.

Source: BTCUSD on TradingView
Although the period of this consolidation cannot be determined, the extent of the drop can be. In 2019, the price dropped by approximately 28% after it broke out of the consolidation pattern. Here, we can assume that a similar drop would put BTC in the $25,000-range. To select the starting point of the drop, the volume profile indicator can be used to determine the point of control [POC] since the 2019 drop also happened around the POC.
Supporting the crash
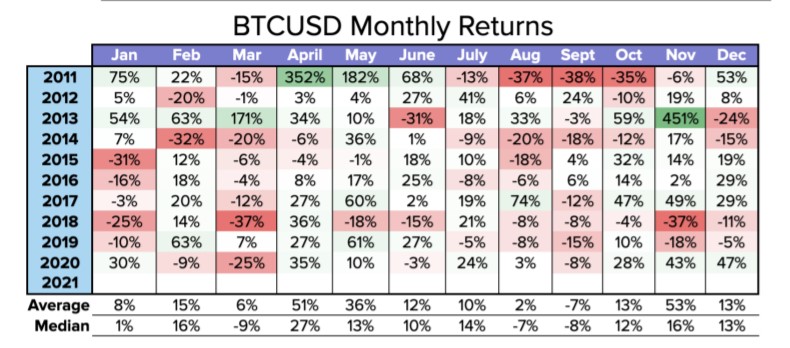
History tells a good story, hence, comparing monthly historical data shows that January isn’t Bitcoin’s best month either.
Source: Kraken
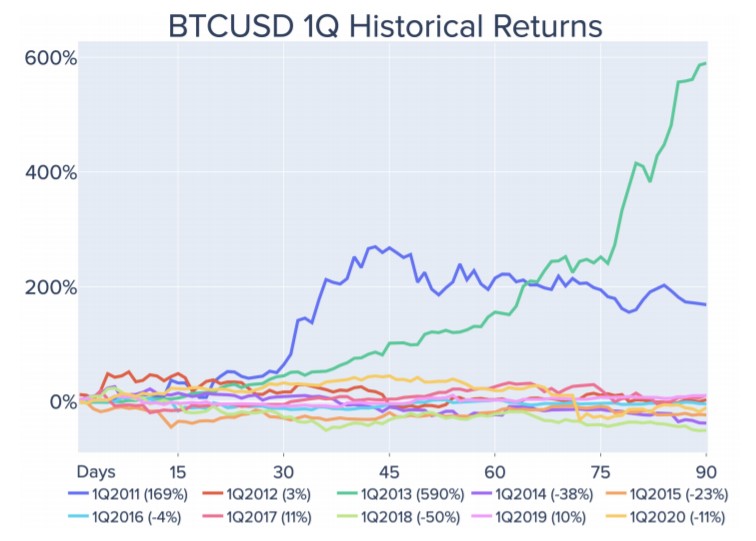
In fact, January has an average return of 8% with a median return of 1%. 2015, 2018, and 2019 registered negative returns. Also supporting this short play are the Q1 returns of Bitcoin, which aren’t really optimistic.
Source: Kraken
With the exception of 2011 and 2013, Q1 returns have stuck close around the zero-line.
Breaking the fractal
The fractals might look similar, however, one key difference is that in 2019, the consolidation was a descending triangle, a formation that has a bearish outlook. However, at press time, Bitcoin was consolidating in a symmetrical triangle, one that has an equally bullish and bearish outlook.