BNB reached near the overbought zone; is a price reversal likely?

Disclaimer: The information presented does not constitute financial, investment, trading, or other types of advice and is solely the writer’s opinion.
- BNB reached the overbought zone, with a possibility of a trend reversal.
- The altcoin could fall to $254.3 or $251.6.
- A breakout above $263.7 would invalidate the bearish forecast.
Binance Coin (BNB) faced a strong FUD in mid-December that sent the price down from around $270 to a new low of $220. However, the bulls found solid support at $231.2 and were able to mount a successful recovery.
However, the price recovery was short-lived, as Bitcoin’s (BTC) sideways structure forced the altcoin market, including BNB, into a trading range.
BNB had been trading between $240 to $251.6 since 18 December. It only broke above this range on 4 January 2023, after BTC recorded an uptrend on the same day.
At press time, BTC’s upward momentum had waned, and BNB was trading at $257.1. The price was flashing red, indicating that a correction may be imminent.
Read BNB’s Price Prediction 2023-24
BNB flashed red: Is a price pullback likely?
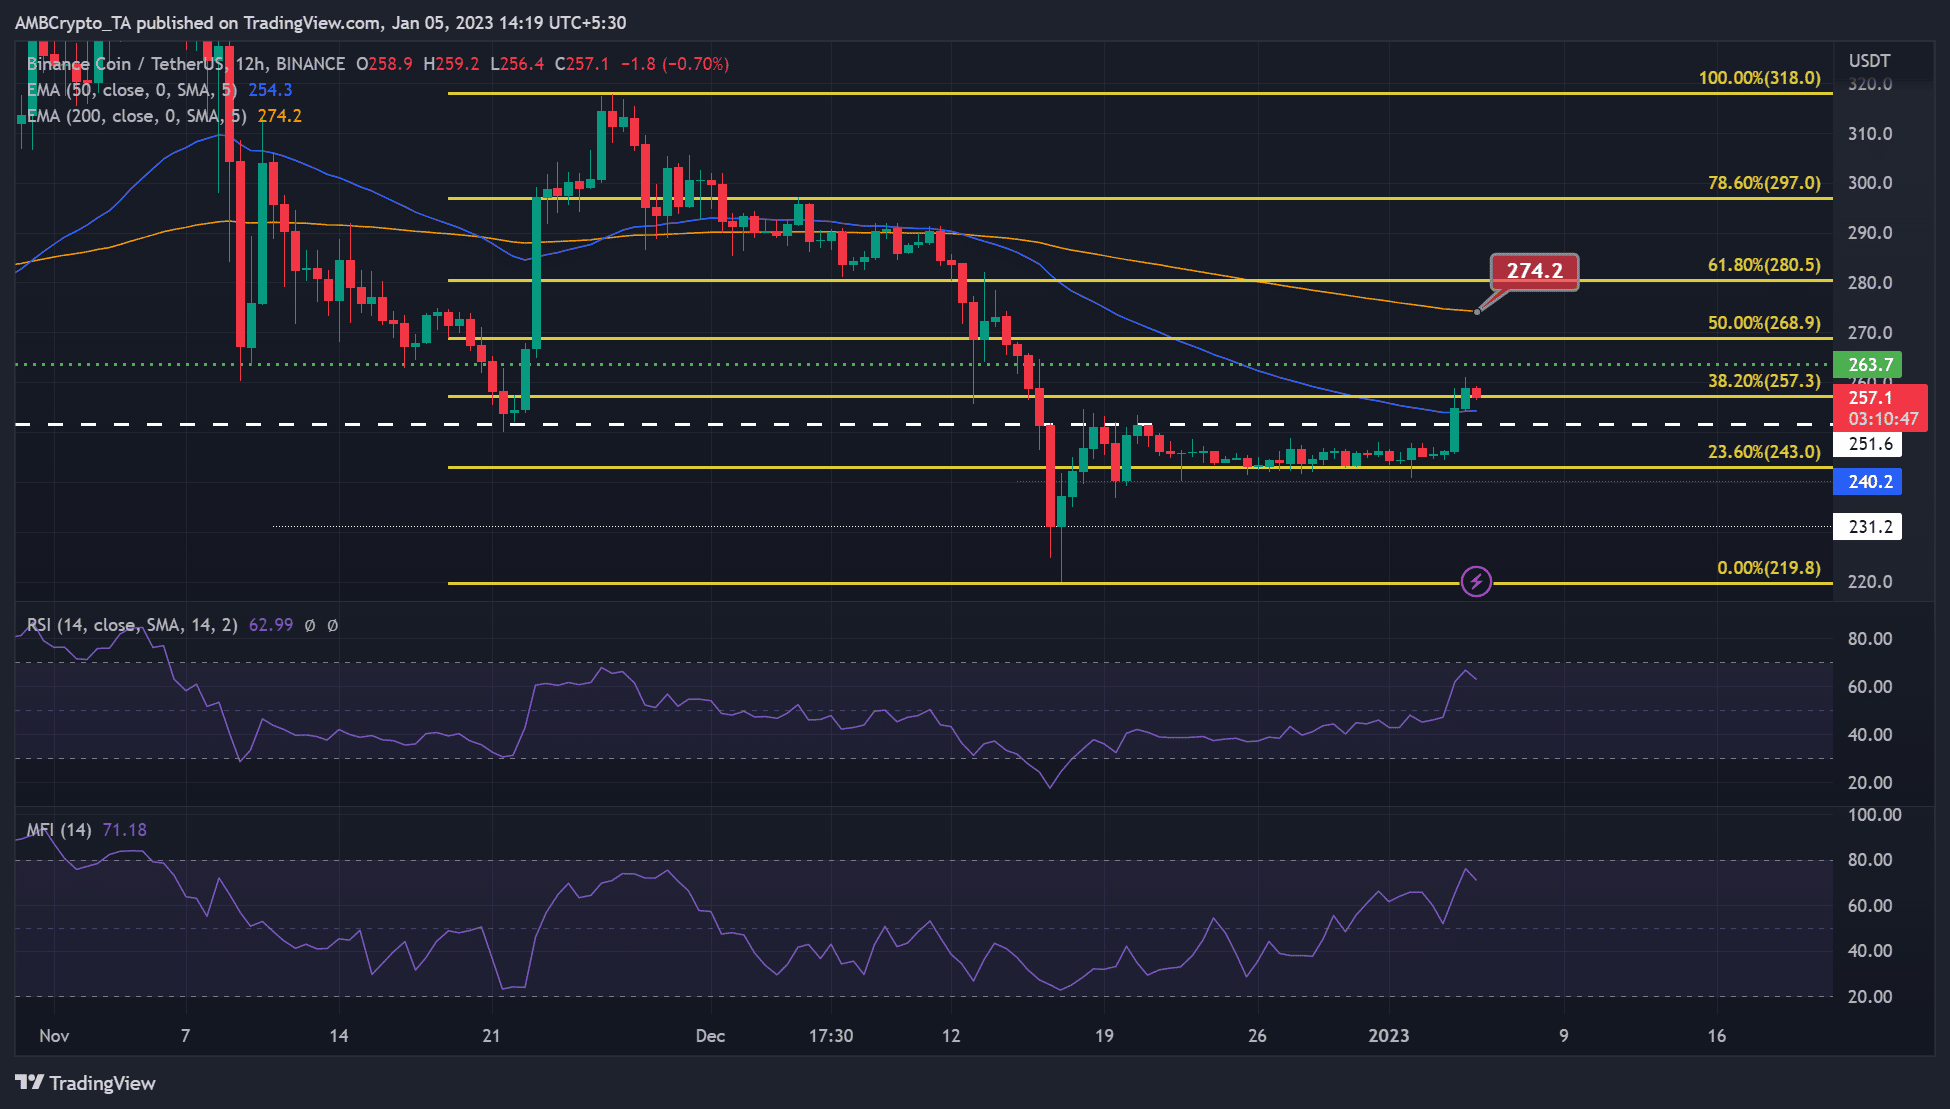
The 12-hour chart flickered red at press time, and technical indicators pointed to a possible trend reversal.
The Relative Strength Index (RSI) was rejected around the 70 mark (overbought zone) and was trending down. This suggests that buying pressure peaked and slowly eased.
The Money Flow Index (MFI) was also rejected near the 70 mark (also in the overbought zone). This showed that accumulation had peaked and a slight distribution had taken place.
If the bears gain momentum, BNB could be forced into a price correction that could reach the 50-period EMA (exponential moving average) of $254.3. If selling pressure intensifies along with a bearish BTC, BNB could fall even lower to $251.6.
These levels can serve as a short-selling target with a stop loss above $263.7.
However, a move beyond $263.7 would invalidate the bearish bias described above. Such an upswing will only boost the bulls if they clear the hurdle at the 50% Fib level of $268.9.
How many BNBs can you get for $1?
BNB saw a slight drop in volume after the recent price increase
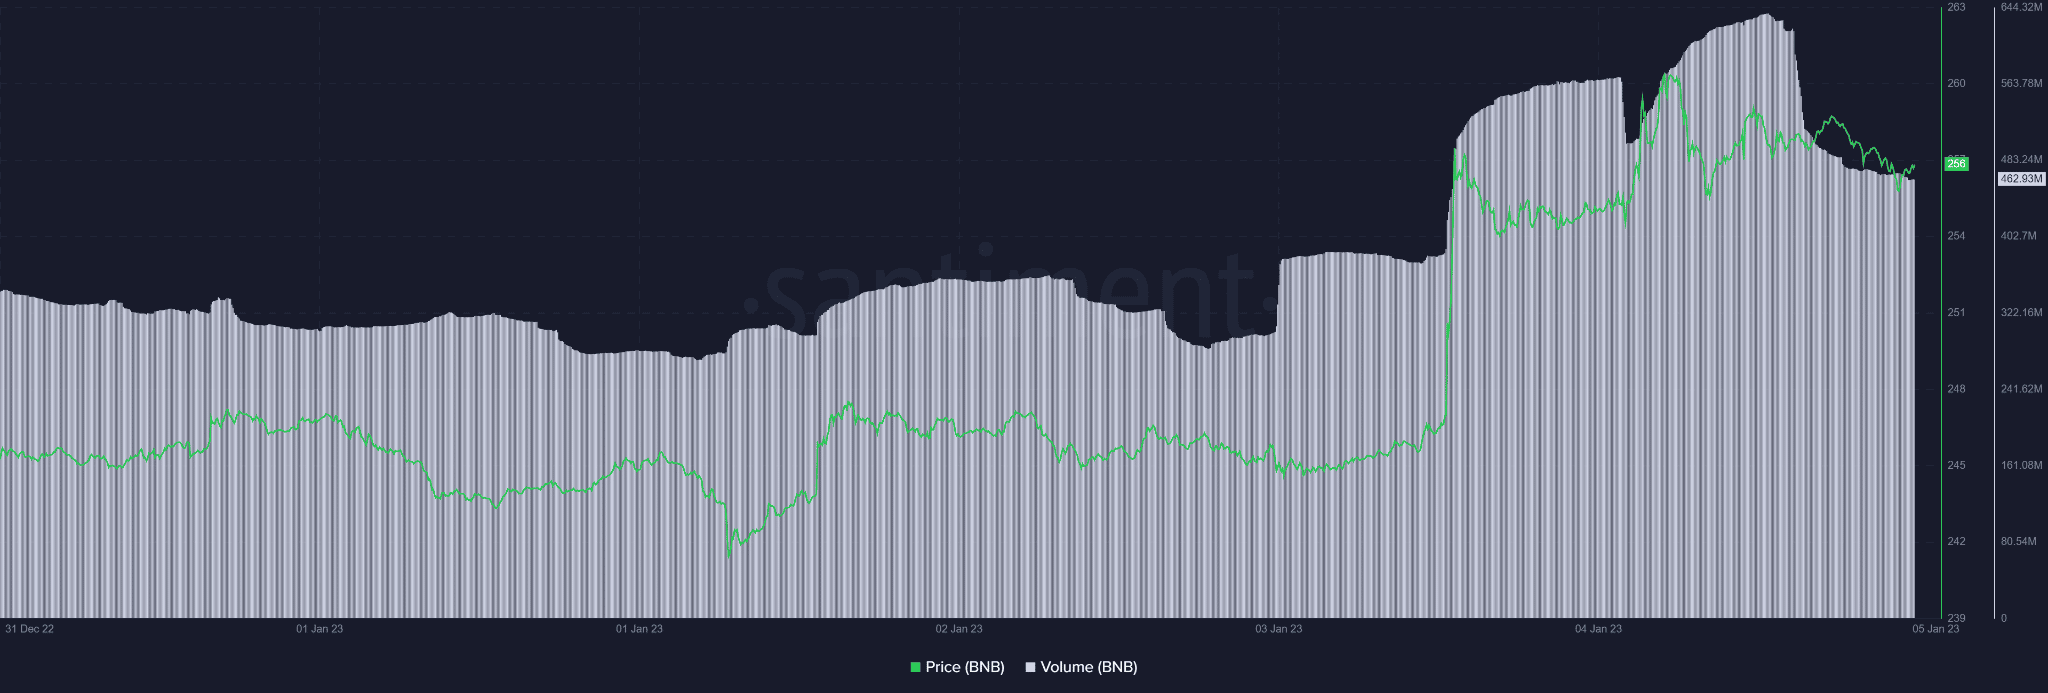
BNB saw a decline in trading volume after the recent price rally peaked. This could undermine buying pressure and push BNB lower.
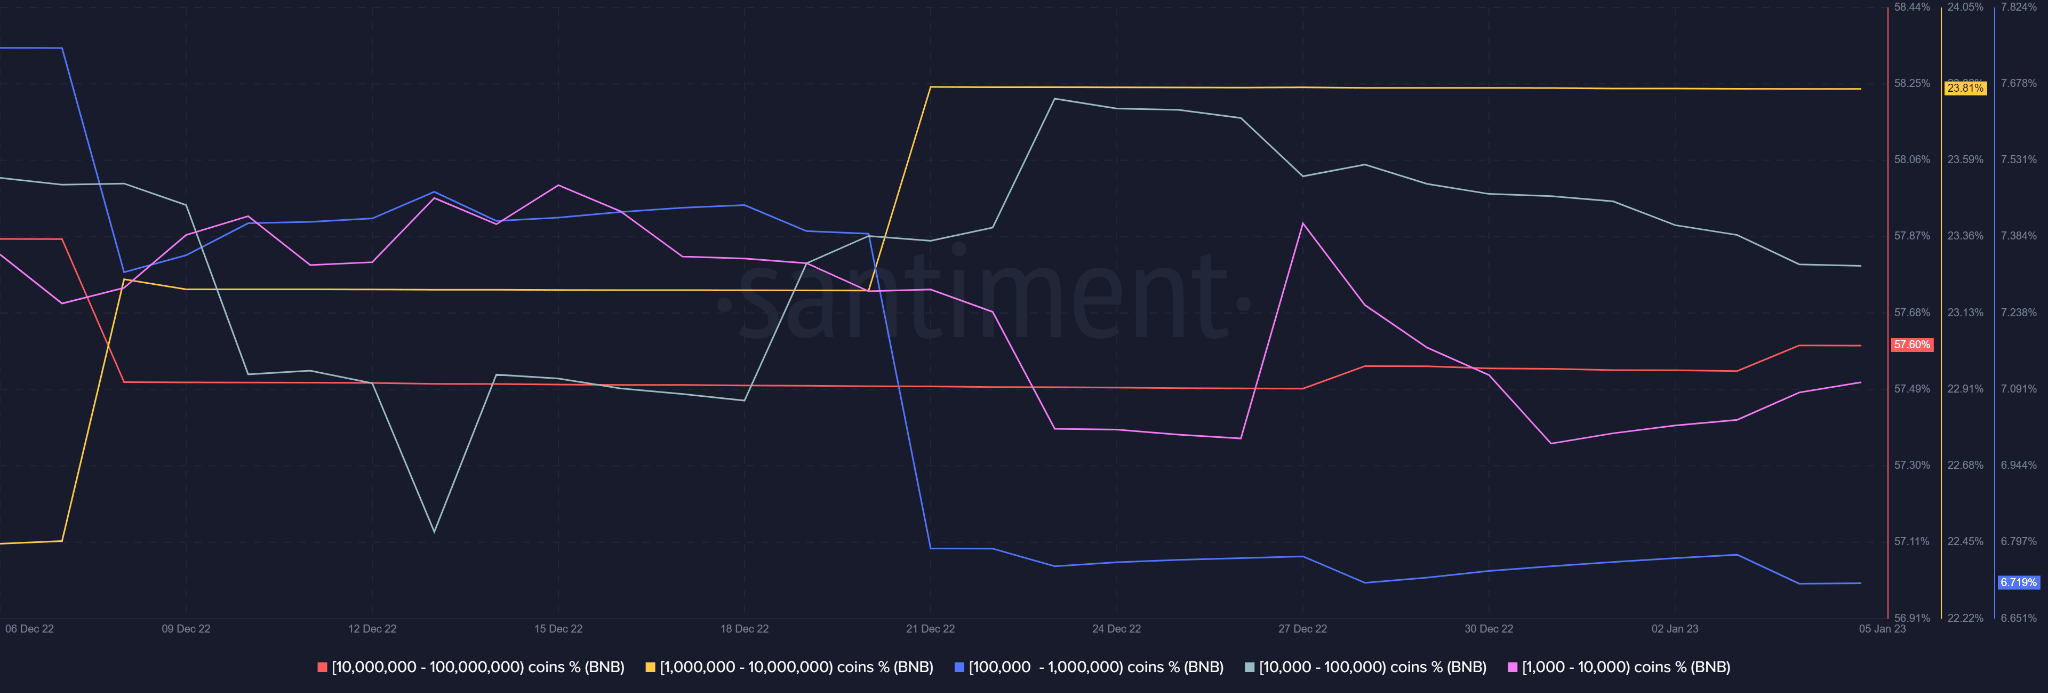
On the supply side, the selling pressure observed at press time came mainly from holders with (10K – 100K) coins. However, the above category accounted for only 3% of the supply.
The supplier category with over 23% ( 1M-10M coins) has been inactive since 21 December.
The next influential and active supplier was the (10M-100M) category, which had over 57% of the total supply. They had accumulated between 3 and 4 January but were inactive on 5 January.
The behavior of the above dormant whale categories can push investors out of their positions, so it is worth tracking their movements.