Can Axie Infinity bulls prevail and push prices above key resistance level

Disclaimer: The findings of the following analysis are the sole opinions of the writer and should not be considered investment advice.
- Open Interest was relatively flat as the price made another lower low
- Crucial resistance zone at $11.5-$11.75 for bulls to flip to support
Axie Infinity announced the release of their newest game, Raylights. However, the number of active players has been falling over the past year. Hence, this latest news can not be expected to have a significant positive impact on the price of the token.
Here’s AMBCrypto’s Price Prediction for Axie Infinity [AXS] in 2022
From a technical analysis perspective, AXS has been in a downtrend since mid-August. The price traded beneath the lows of June and July, and the trend could continue to be bearish in the coming weeks.
Lower timeframe Bollinger Bands tighten as AXS approaches resistance
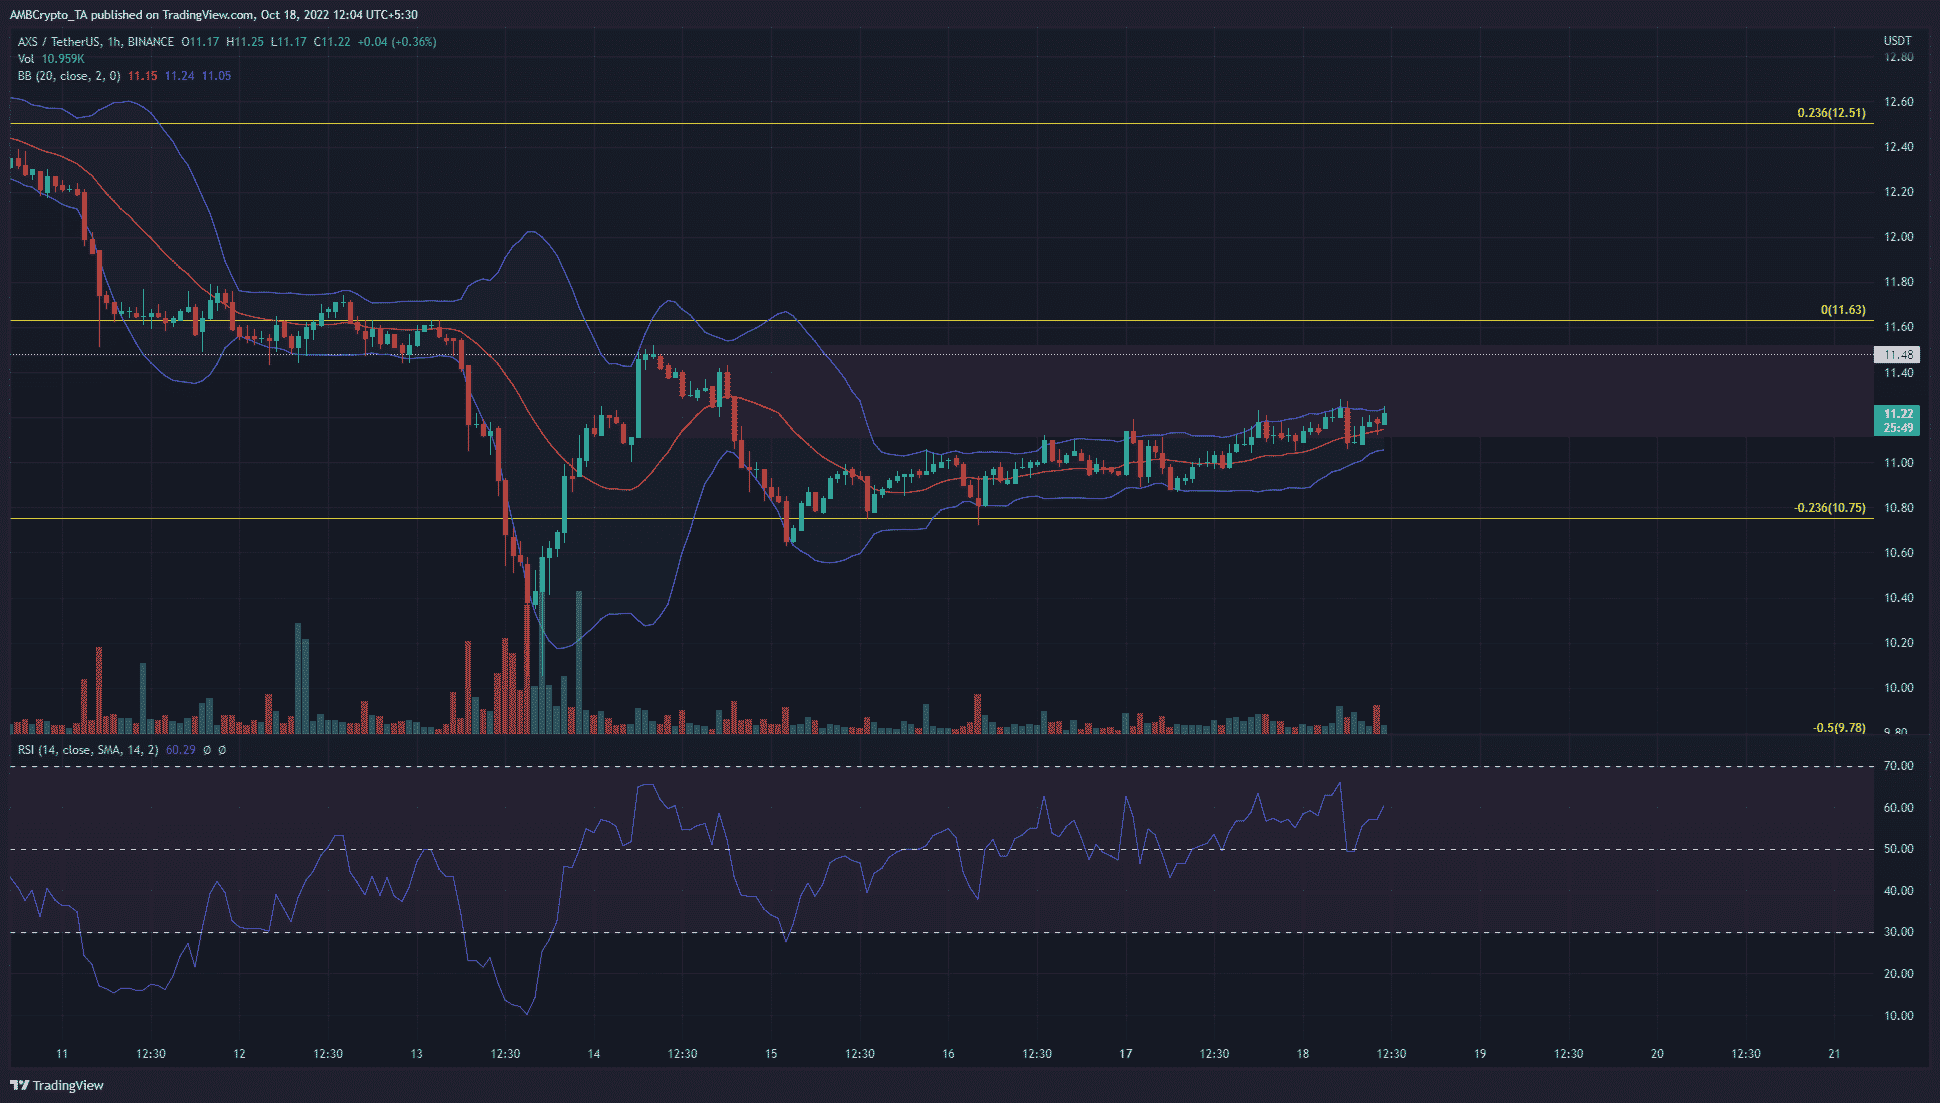
On higher timeframes such as 4-hour and daily, the market structure was bearish. Therefore, the lower timeframe bias can also be taken to be bearish. At the time of writing, the short-term momentum was bullish. This was shown by the series of higher lows and higher highs that AXS registered over the past couple of days.
A strong level of resistance stretching as far back as April 2021 lay at $11.5. Moreover, this same level has been important in the past week. It was even retested as resistance a few days ago. A bearish order block formed and was marked in red.
The RSI showed lower timeframe bullish momentum for the token of Axie Infinity. The Bollinger Bands were somewhat tight around the price and indicated that the asset has not been volatile recently. The volume traded has not been high either, which indicated the possibility of the rally from $10.6 being weak.
If the Bollinger Bands see an expansion in the next few hours, it would indicate a return of volatility. In the meantime, the lower band near $11 can be taken as very short-term support.
Open Interest flat over the past week as price moves lower
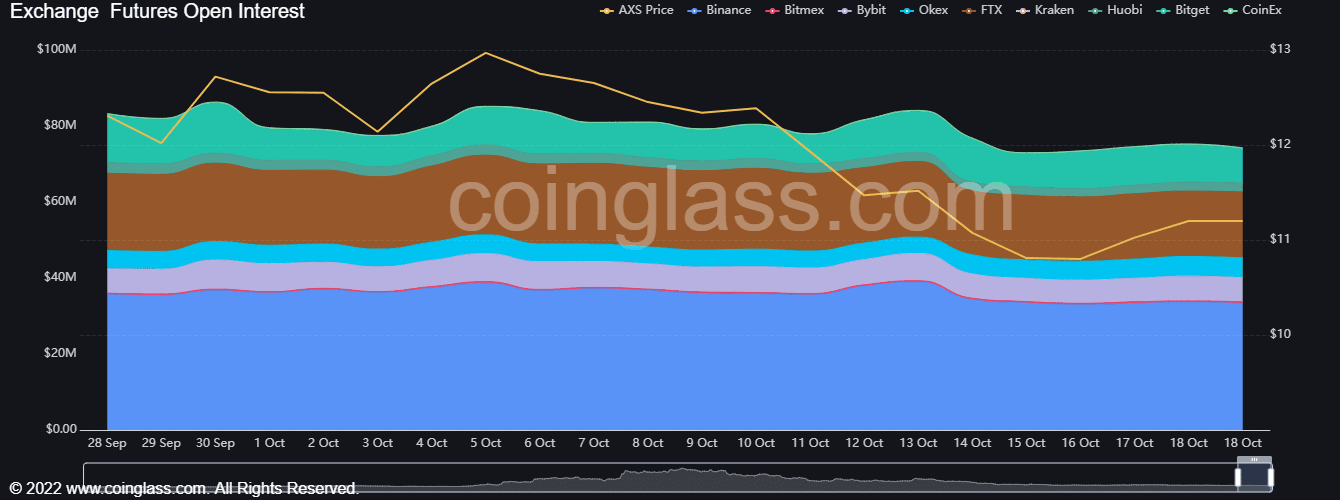
Over the past week, Coinglass data showed the Open Interest figures to be around the $75 million mark. This was at a time when the price continued its downtrend, and was able to pick itself up from the $10.3 low.
There has been a minute uptick in the OI in the past three days, but overall the information was not yet actionable. If a surge in OI follows a move past $11.5, it can indicate a continuation of the lower timeframe uptrend. On the other hand, a failure to break past $11.5 could encourage short sellers over the next day or two.