Can Ethereum [ETH] bear the loss of desperation in the wake of…

- A Crest or trough trend per the exchange inflows could determine if ETH would succumb to a price decrease
- ETH approached the overbought region as directional movement was not firm
Ethereum [ETH], the second largest cryptocurrency by market capitalization gained 8.74% in the last seven days. However, this increase could be short lived as per a CryptoQuant analyst.
Joawedson, the analyst, referred to the manner in which the exchange flows affect ETH as the basis for his forecast.
Read Ethereum’s [ETH] price prediction 2023-2024
Unfazed by ETH’s impression
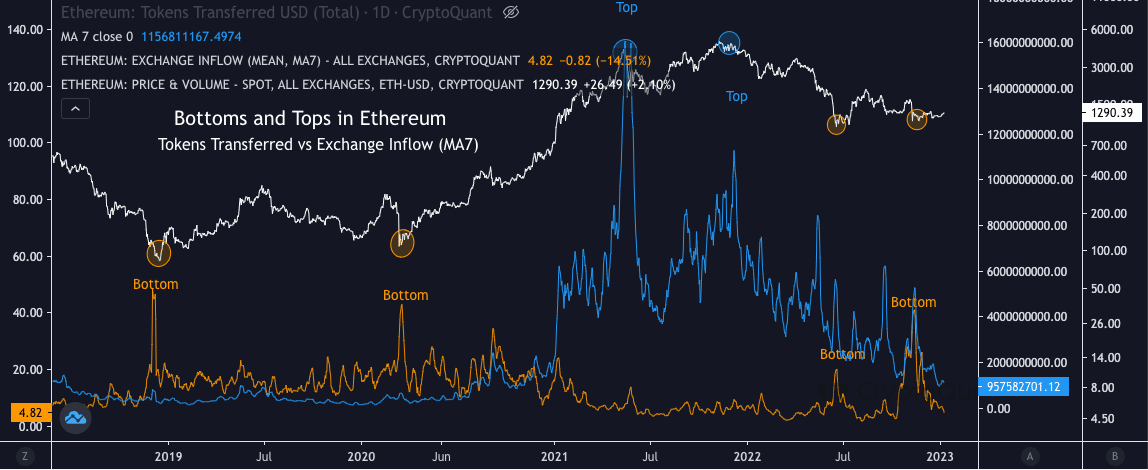
Furthermore, the trend displayed by the exchange flows act as a yardstick for evaluating potential tops and bottoms. According to CryptoQuant data, the exchange inflow last hit notable peak values around November 2022.
The seven-day Moving Average (MA) also seemed to follow a similar trend. However, recently both metrics indicated a decrease from the crest. This implied that investors who have held ETH for long might be distressed from its long decline period. Hence, investors could consider selling their holdings.
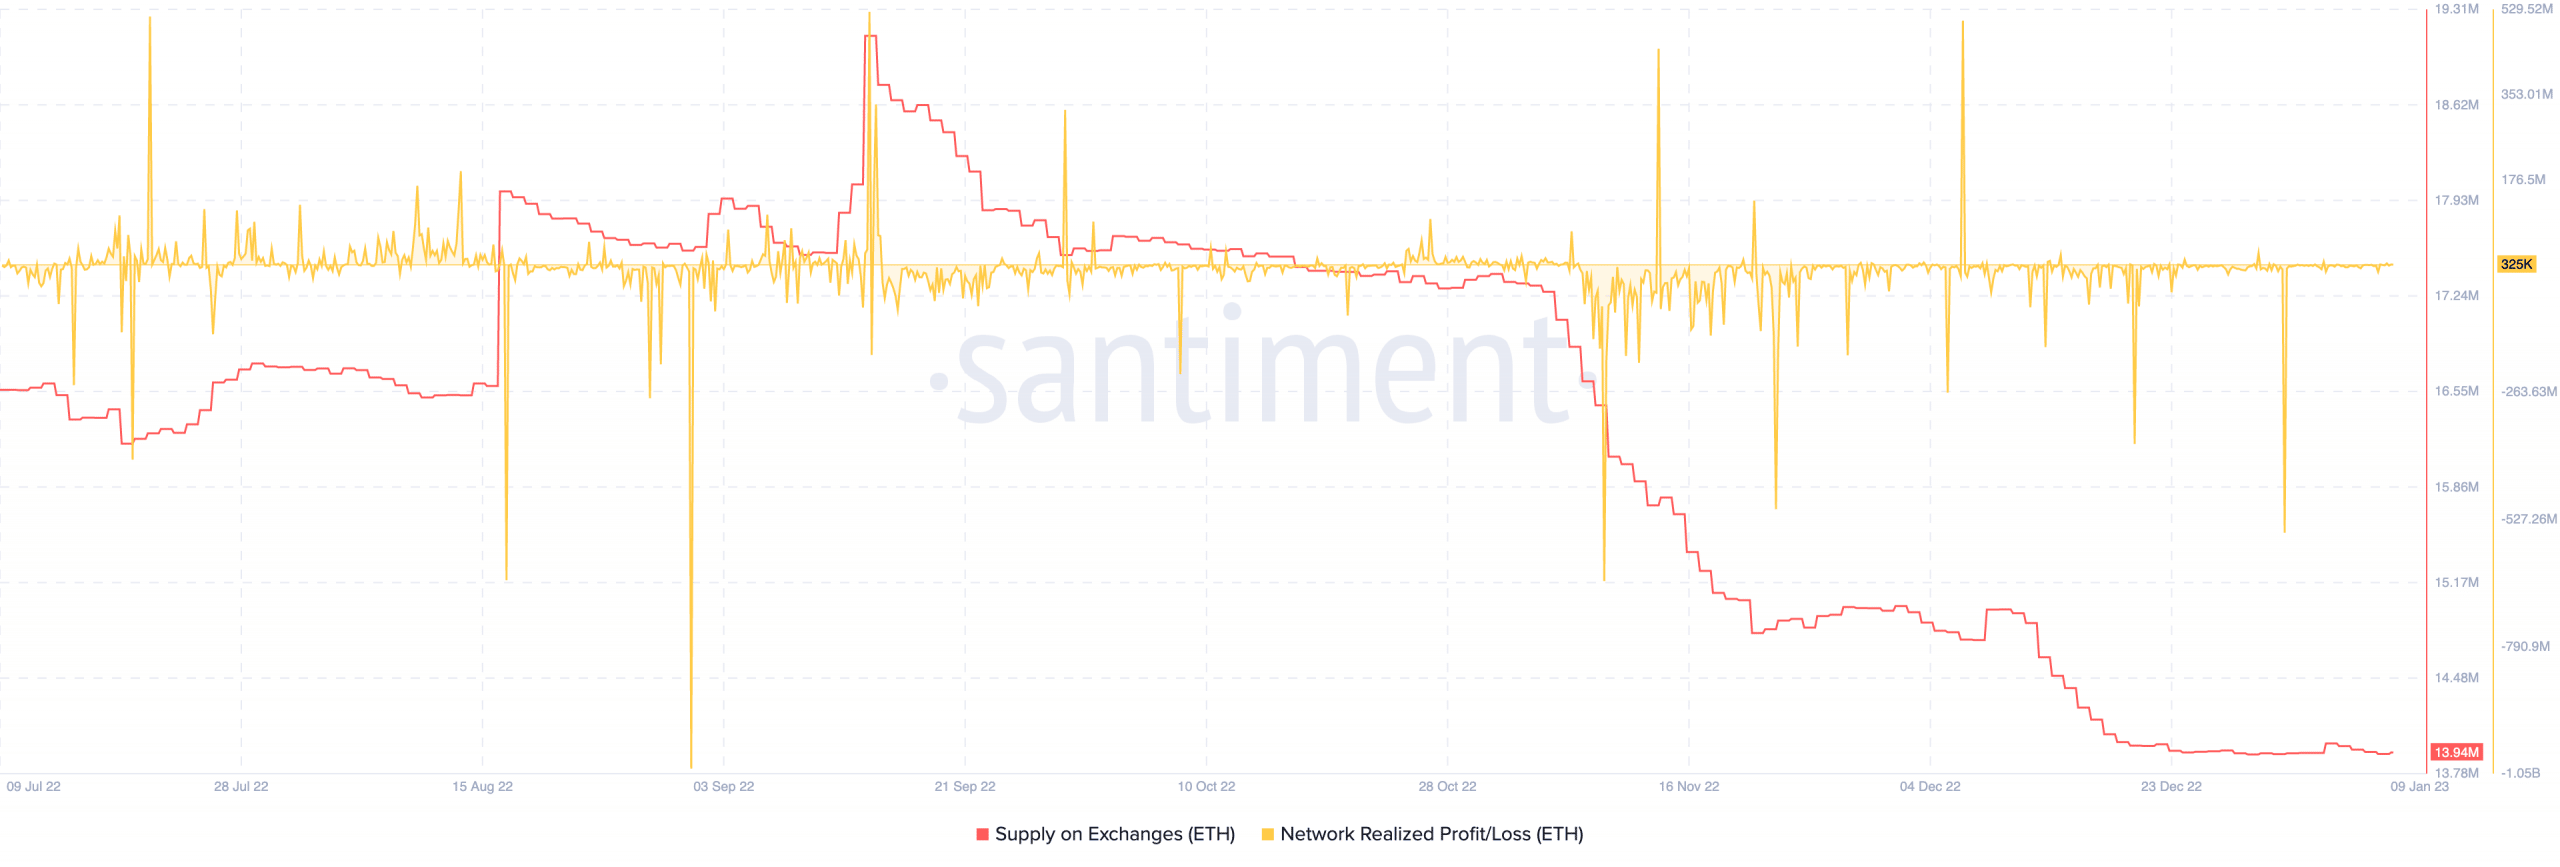
For the time being, Santiment showed that ETH supply on exchanges has been lowering since 9 December 2022. Since there was no spike in this regard, it meant short-term sell pressure was not extremely high.
This differed from the what was displayed by the exchange inflow MA. So, ETH had a chance to escape capitulation in the short term.
In other parts, the network realized profit and loss was at 325,000. This value depicted an upturn from the sharp decrease on 1 January. Note that the metric is used to calculate the profit or loss accumulated by holders over a period of time.
As the value was not negative, it suggested increased capital inflows. But since there was no sign of a rising peak, it could not be ascertained if there was a high demand being established.
Are your holdings flashing green? Check the ETH Profit Calculator
A fall could be imminent because…
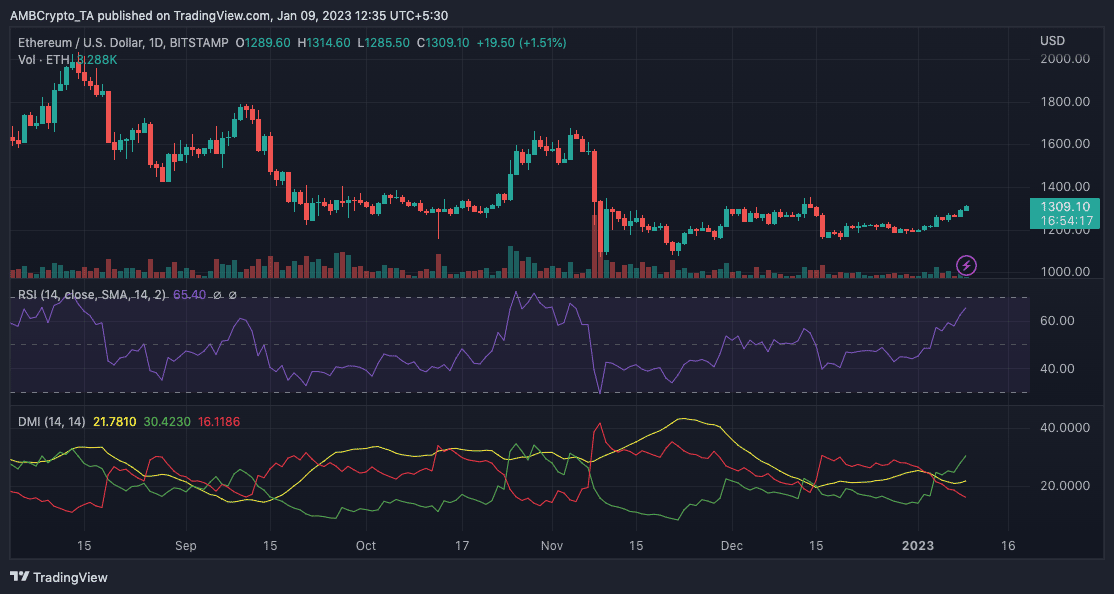
Meanwhile, ETH’s impressive performance could actually be truncated, according to the indications from the daily chart. At press time, altcoins witnessed significant demand. This helped escalate the Relative Strength Index (RSI) which went as high as 65.40.
This region indicated that ETH was rapidly approaching the overbought level. Traditionally, if the RSI hits the overbought zone, ETH would most likely reverse its trend. Furthermore, its Directional Movement Index (DMI), showed the buying power was not as solid as investors might have anticipated.
Although the positive DMI (green) was higher, the trend of the Average Directional Index (ADX) did not buttress the directional strength. At 21.78, the ADX (yellow) showed that ETH’s bullish direction was slightly void of vigor.