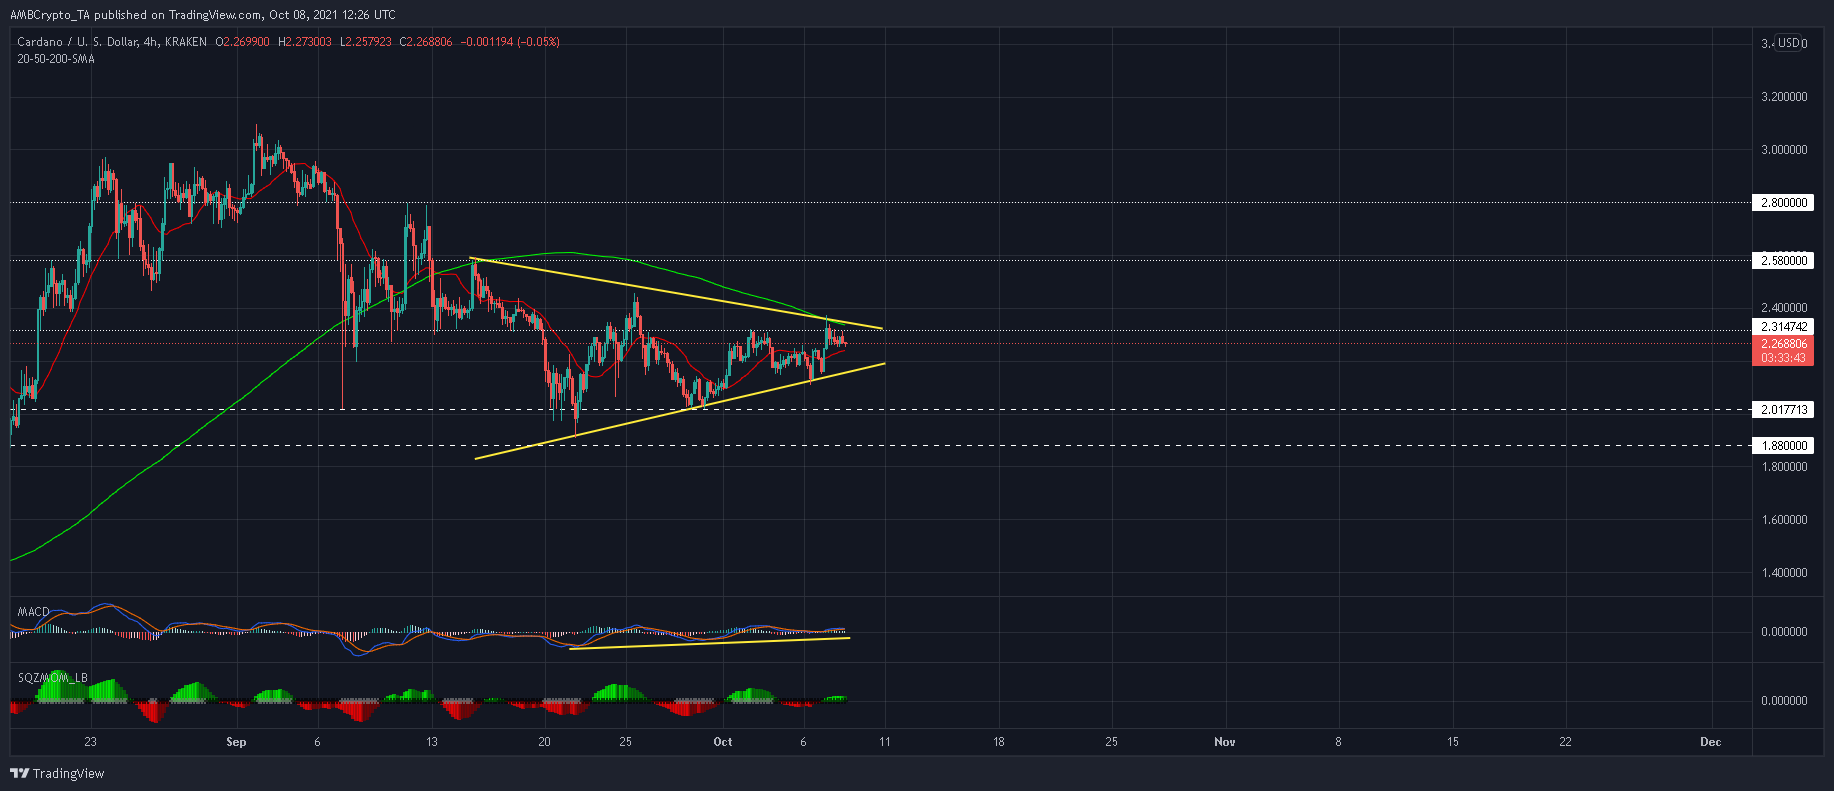
Cardano: A look into how traders can capitalize on this symmetrical triangle

An earlier article indicated that Cardano was taking shape within a symmetrical triangle and that a major price swing was due for the world’s third largest digital asset. This time around, specific price levels were identified for traders willing to long (or short) this setup once a breakout occurs. At the time of writing, ADA traded at $2.28, down 2.2% over the last 24 hours.
ADA 4-hour Chart
As highlighted earlier. ADA awaited a near 30% breakout in either direction based on the highest point at $2.43 and lowest point of $2.06 within the pattern. The 4-hour timeframe was also used in order to identify key swing highs and lows which could provide confirmation for a breakout. For bulls, a strong close above the confluence of 4-hour 200-SMA (green) and 7 October’s swing high of $2.37 would heighten chances of a favorable outcome.
Traders can take up long positions after this development and set their take-profits between $2.96-$3. Keep in mind that ADA would need to negotiate resistance zones of $2.58 and $2.80 in order to maximize gains. Meanwhile, stop-losses can be placed below 6 October’s swing high of $2.11.
On the other hand, a close below the 20-SMA (red) could extend to a breakdown from the pattern. Short-sellers can place bets once ADA slices below the $2-mark and set up a reasonable take-profit at $1.87, bagging gains of 7%. Even though a 25% breakdown would translate to a steeper take-profit for short-sellers, a risk-on broader market could prevent ADA from declining all the way to the $1.5 mark.
Now if ADA moves sideways between $2.31 and its 20-SMA (red) over the next week, chances of a breakout would severely diminish.
Reasoning
The Squeeze Momentum indicator suggested that upwards pressure was already creeping into the market. However, traders must refrain from taking positions till the index witnesses a ‘squeeze release’. Favorable readings were also present on the Directional Movement Index and the MACD.
Another area traders can keep a close eye on is over the 24-hour trading volumes. During an upwards breakout, spot volumes across exchanges generally register a considerable uptick. Conversely, volumes remain low during the onset of a breakdown.
Conclusion
Based on bullish readings on ADA’s indicators, bulls were favored to tip a breakout in their favor. The best-case outcome could even see ADA jump all the way up to $3 before any countermeasures are taken by the sellers. However, a bearish outcome cannot be discounted as well. Traders should keep an eye on the aforementioned indicators along with its trading volumes to get more clarity.


