Cardano, Binance Coin, Solana Price Analysis: 10 October
Cryptocurrencies continued to trade in the green on 10 October. The global cryptocurrency market cap noted a 0.69% increase to reach $2.29 trillion, however, the market volume decreased by 15.86% over the last 24 hours. Cardano showed positive price action, meanwhile, Binance Coin and Solana appeared to be in for some difficult days ahead.
Cardano (ADA)

Cardano shot up by nearly 0.34% over the last 24 hours and was trading at $2.27, at the time of writing. The resistance mark stood at $2.9 while the price seemed to be consolidated near $2.1. Technical indicators showed signs of bullish price action.
Relative Strength Index for most sessions remained above the mid-line, indicating that the momentum belonged to the buyers. MACD approached a bullish crossover pointing towards an uptrend. Awesome Oscillator flashed medium-sized green bars on its histogram giving a strong hint to buyers.
Binance Coin (BNB)
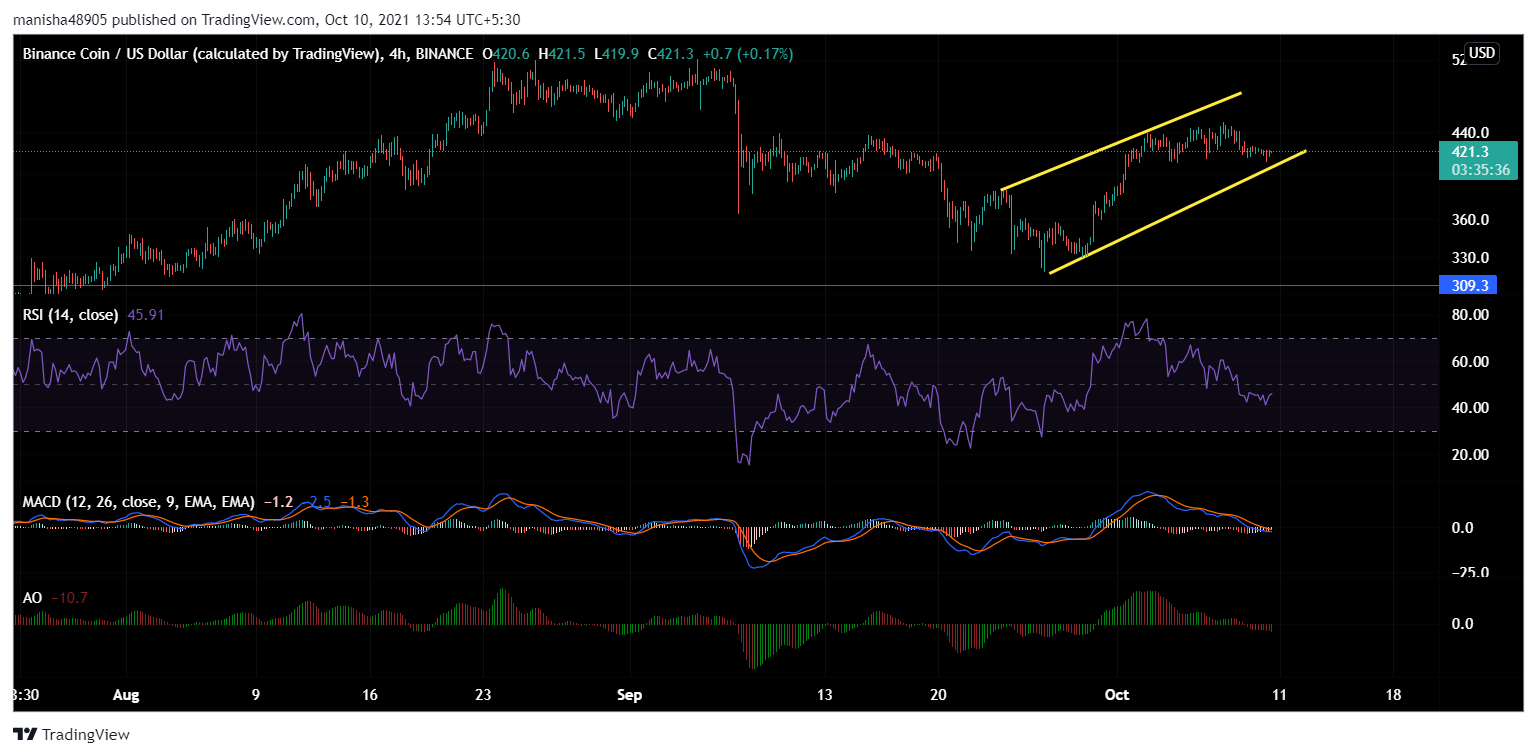
Since bouncing back from the low seen on 26 September, BNB’s price oscillated within the confines of an up-channel. However, its price dropped by 0.50% to $420 in the last 24 hours, at press time.
A macro view suggested that the prices showed recovery owing to buyers resurfacing in the market since the end of last month. Relative Strength Index stood near the 60-mark over a majority of recent sessions, indicating the price momentum belonged to the buyers. However, at press time, it was seen below the 50-mark.
MACD approached a bullish crossover at the beginning of this month, however, it flashed red signal bars over its latest session. Awesome Oscillator displayed bullishness with its green histogram bars.
Solana (SOL)
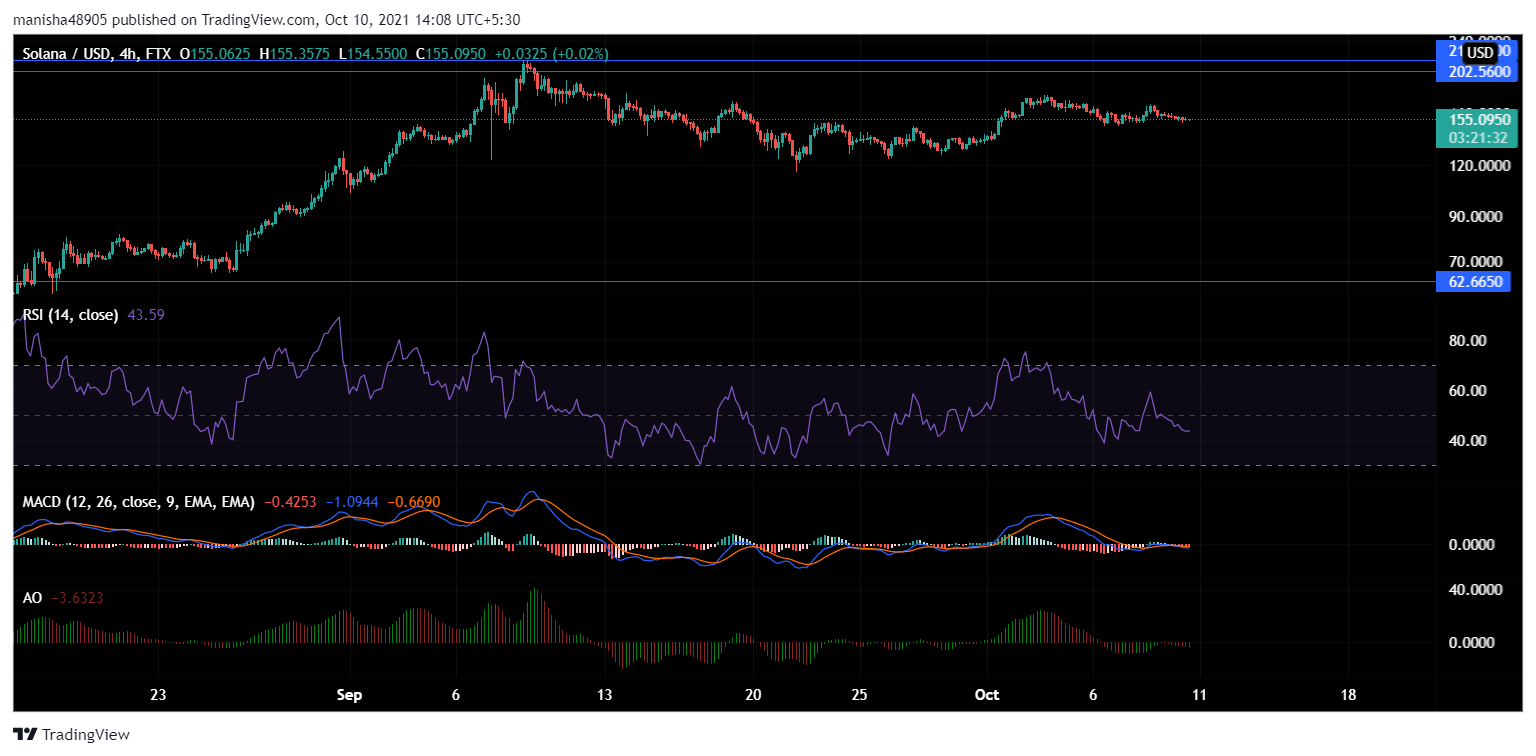
Solana fell by 3.15% to reach $154 in the last 24 hours. The overhead resistance was capped at $202. Since the beginning of this month, Solana has been making slow progress, however, the price appeared to be consolidated near the $150 mark.
Relative Strength Index was close to oversold levels and a near-term reversal looked probable. MACD’s trajectory shifted below the mid-line in its latest session which indicated, selling pressure in the market can’t be ruled out.
Awesome Oscillator with red signal bars signified a bearish inclination which points toward trend reversal.


