Cardano, GALA, Filecoin Price Analysis: 08 February

As the overall sentiment finally skewed away from the fear zone, Cardano rose above all its EMA ribbons. But it showed resistance at its three-month Point of Control. Further, although the near-term technical indicators of GALA and Filecoin affirmed the bullish vigor, they also hinted at slightly decreasing buying power on account of the overbought readings.
Cardano (ADA)
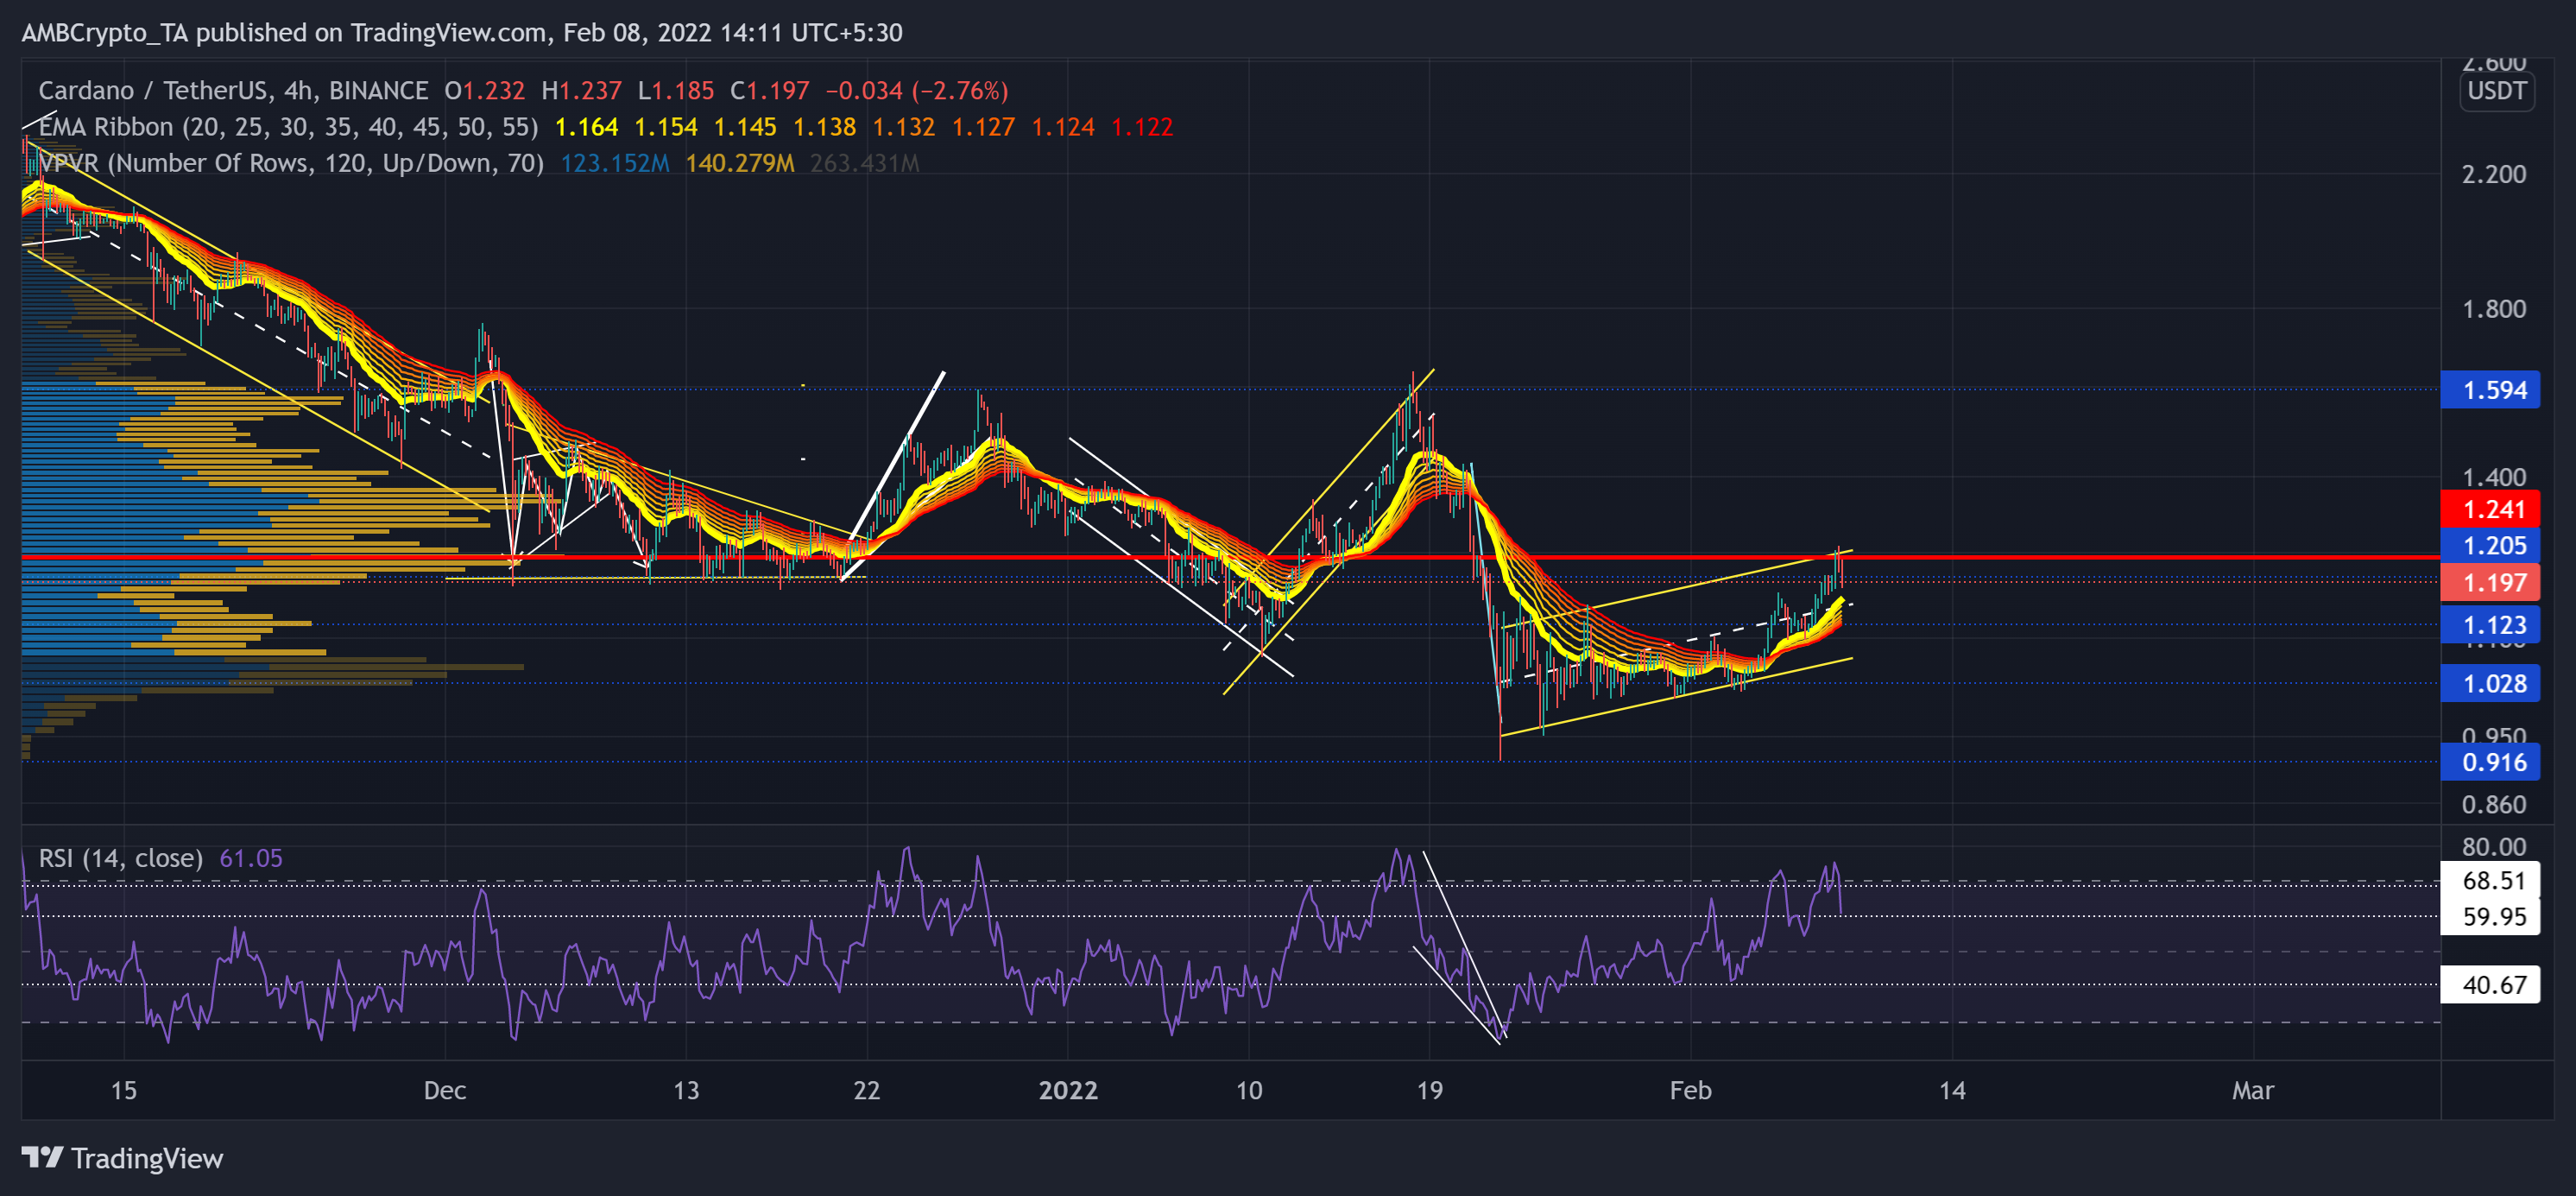
The up-channel (yellow) breakdown from the $1.59-mark led ADA bears to test the $1.02-level multiple times over the past 17 days. The alt fell by 44.2% (from 18 January) and poked its nine-month low on 22 January.
Since then, ADA saw a 24.8% recovery as it tested its upper trendline of the up-channel (yellow). Thus, it reclaimed the $1.2-mark while moving above all its EMA ribbons. Now, as it pulled back, further retracements would find a testing point near the 20 EMA. Moreover, the bulls struggled to topple the immediate resistance near its Point of Control (red).
At press time, ADA traded at $1.197. The RSI steadily marked higher peaks as it drifted into the overbought region. The 59-mark support would be crucial for bulls to uphold to prevent a further downfall.
GALA
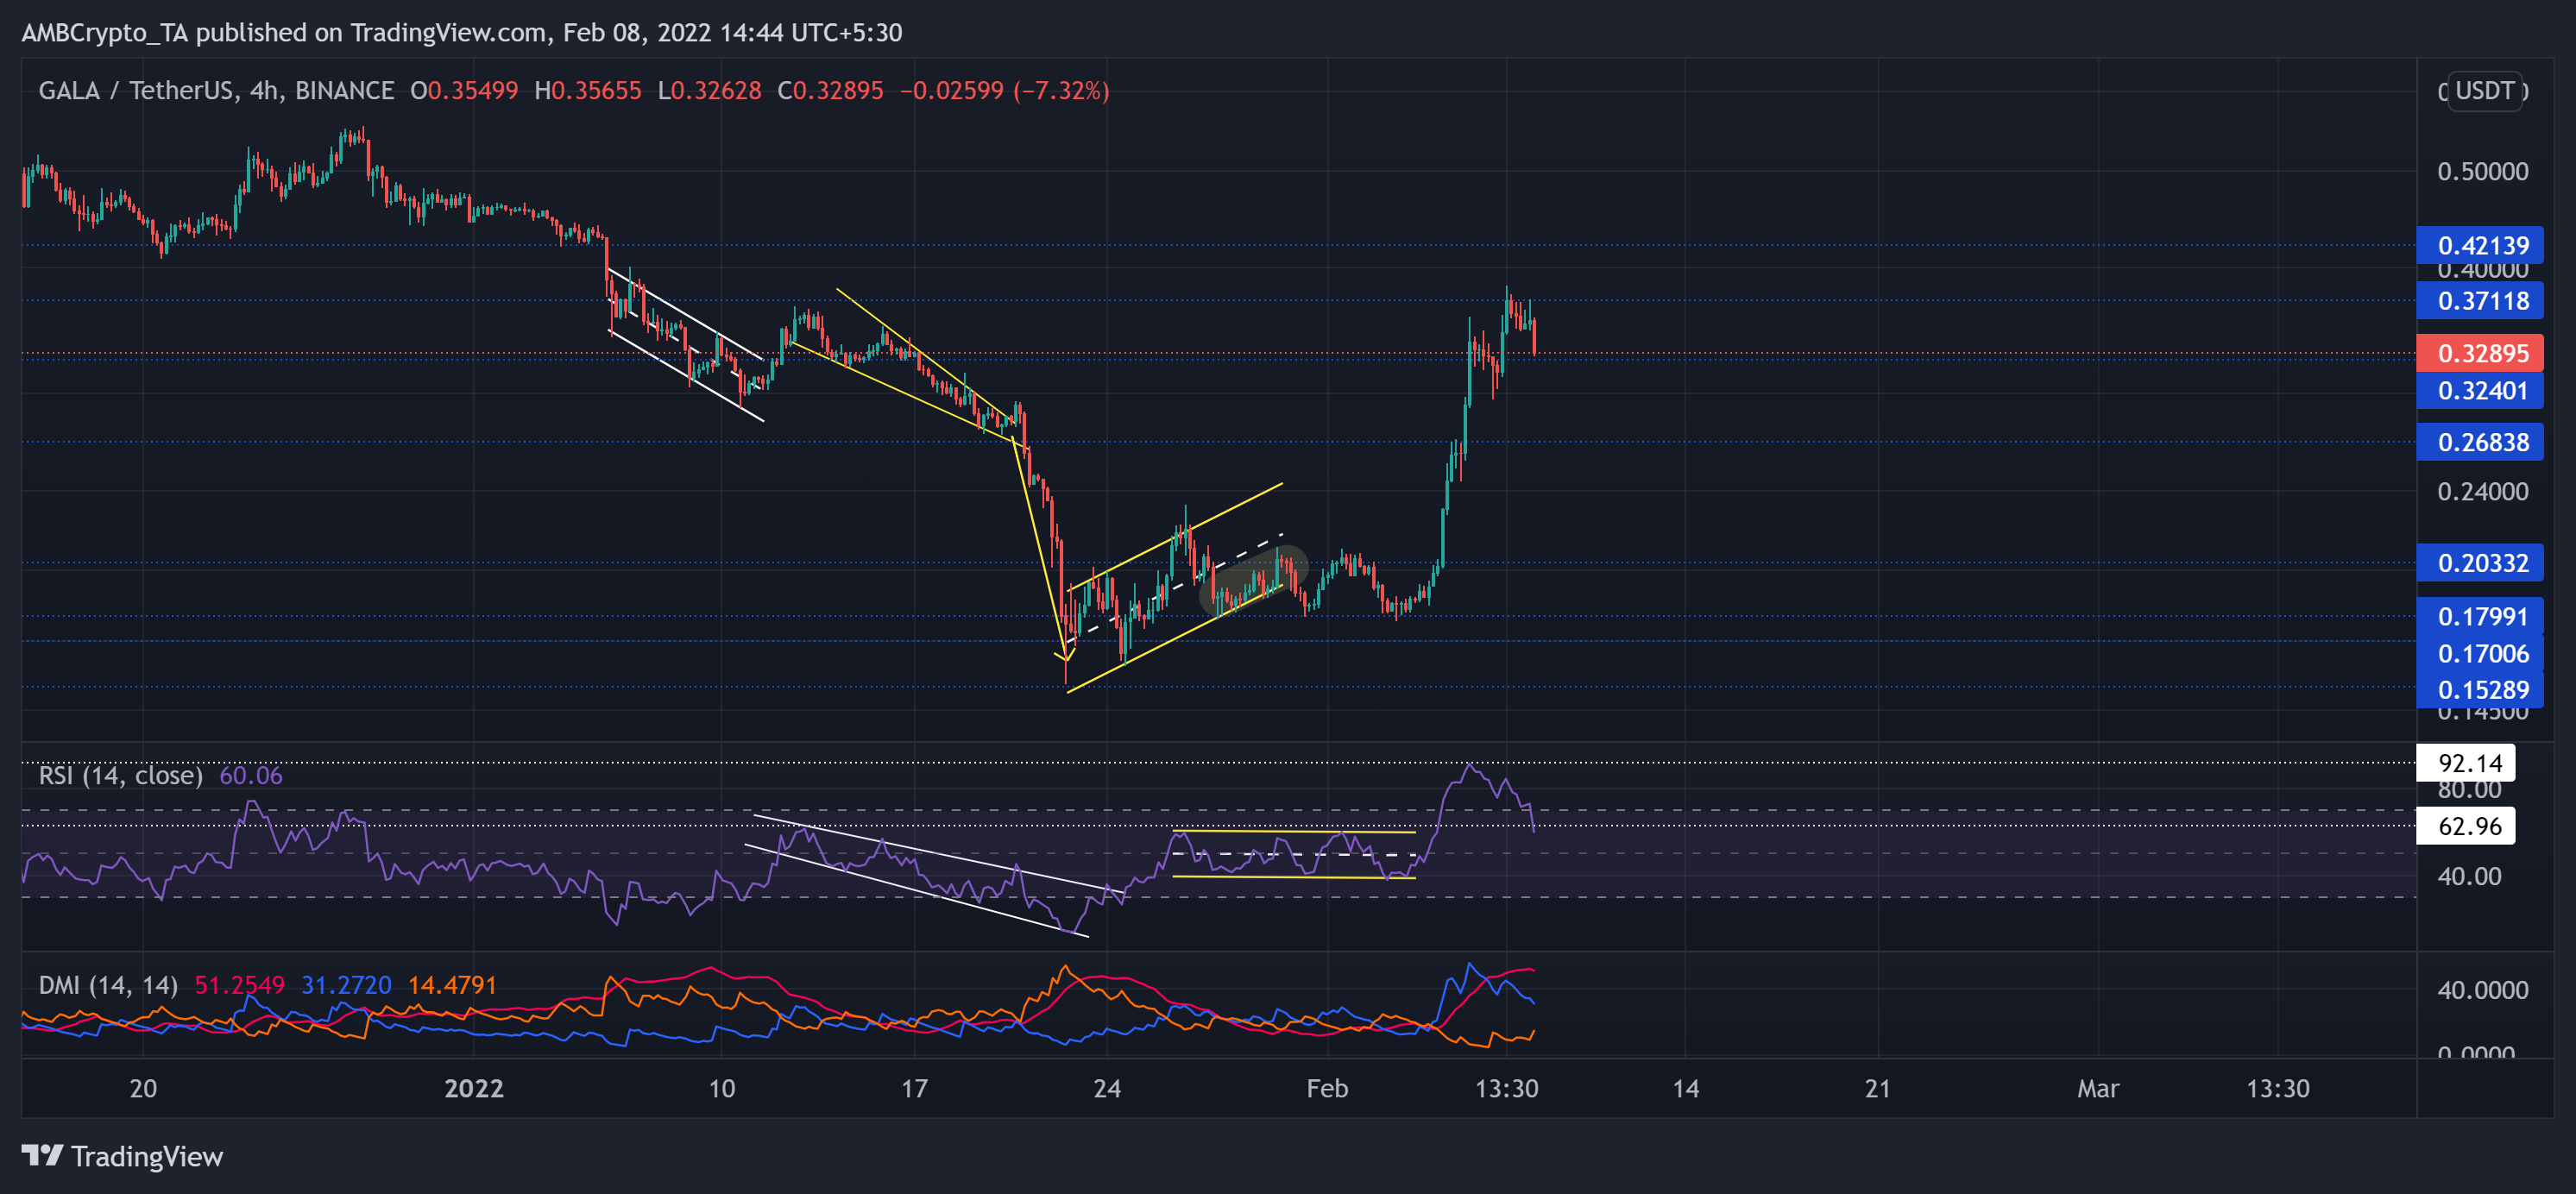
GALA lost its bullish vigor after it failed to uphold the $0.421-resistance. Then, it even lost the $0.32-level only to witness another sell-off on 21 January. GALA lost 58.16% of its value (from 12 January) until it touched its two-month low on 22 January.
The alt witnessed a classic bearish flag breakdown from the $0.203-mark on 30 January. Since then, the bulls kept exerting sustained pressure as the alt saw a 110% ROI until it tested the $0.371-mark on 7 February. From here on, any pullbacks would find testing support at the $0.32-mark.
At press time, GALA was trading at $0.32895. The recent RSI revival saw a strong breakout from the rectangle top (yellow). It poked its record high of 92 before plunging below the 62-level. Also, with the gap between +DI and -DI reducing, the RSI eyed to retest the equilibrium.
Filecoin (FIL)
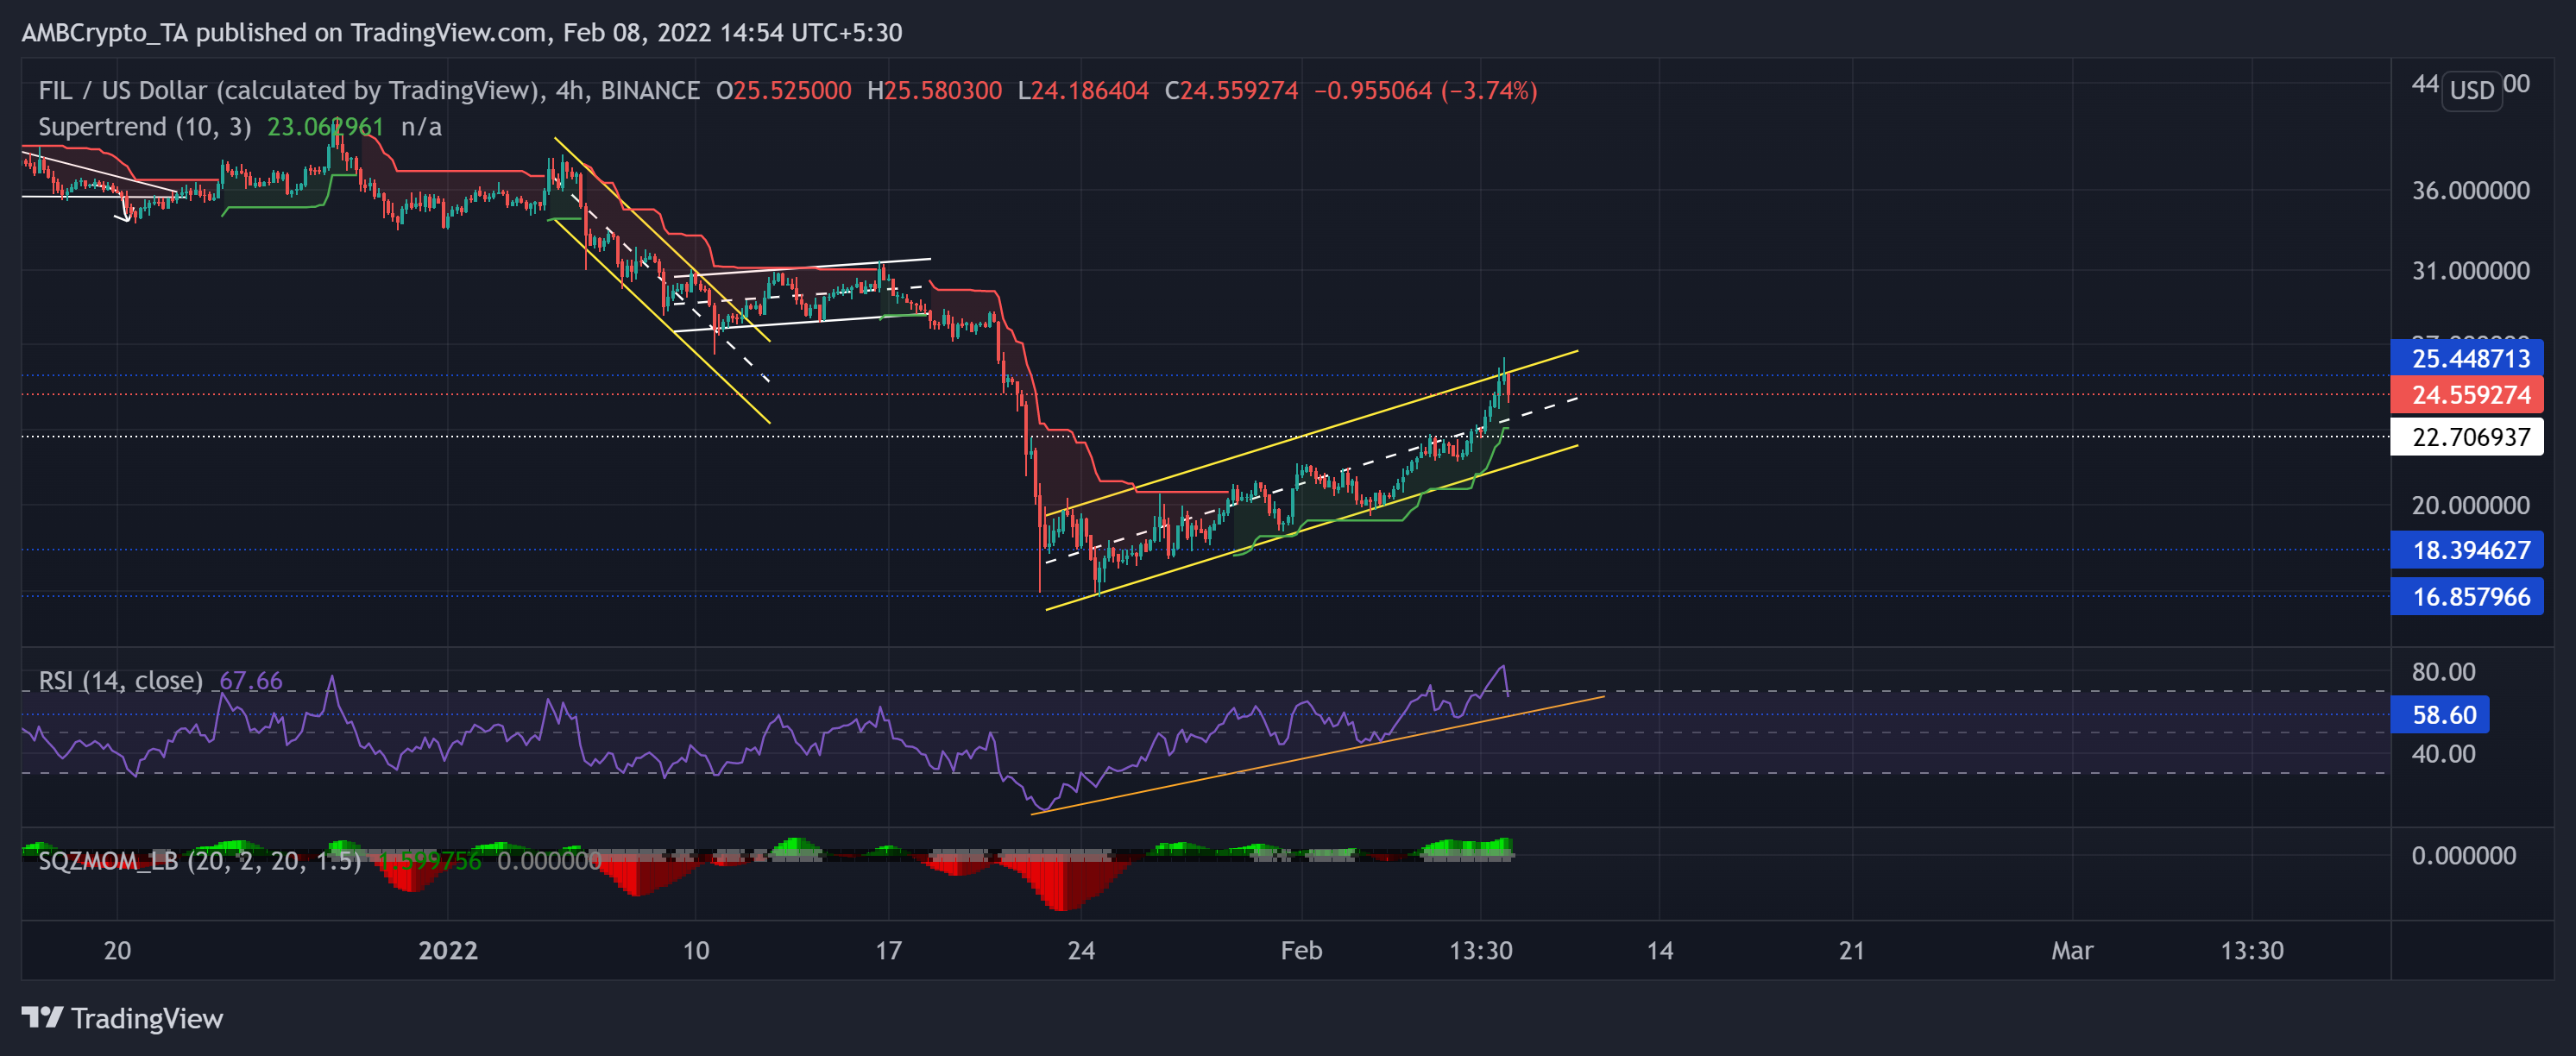
FIL bears initiated a staggering 46.59% downturn over the past week and ensured a sustained breakdown below the up-channel (white). Since then, the altcoin saw an up-channel recovery that bagged in 54.2% ROI in the last two weeks.
Meanwhile, the Supertrend continued to flash a buy signal. The immediate testing support now stood at the $22.7-level.
At press time, FIL traded at $24.559. After dropping from the overbought region, the RSI headed to test its trendline support. Any close below 58-level support would be detrimental for the bulls. Also, the Squeeze Momentum Indicator continually flashed grey dots. Thus, still entailing a high volatility phase.