Cardano: Identifying the ideal long entry for traders

Disclaimer: The findings of the following article are the sole opinions of the writer and should not be taken as investment advice
Since 22 July, Cardano has held firm above the half-line of its ascending channel. The last few days, however, projected a bit of a correctional phase for the digital asset. ADA’s price, at press time, was heading towards the lower trendline of its pattern. However, it can be expected to reverse at a critical support area.
At the time of writing, Cardano traded at $1.26, down by 0.5% over the last 24 hours.
Cardano Daily Chart
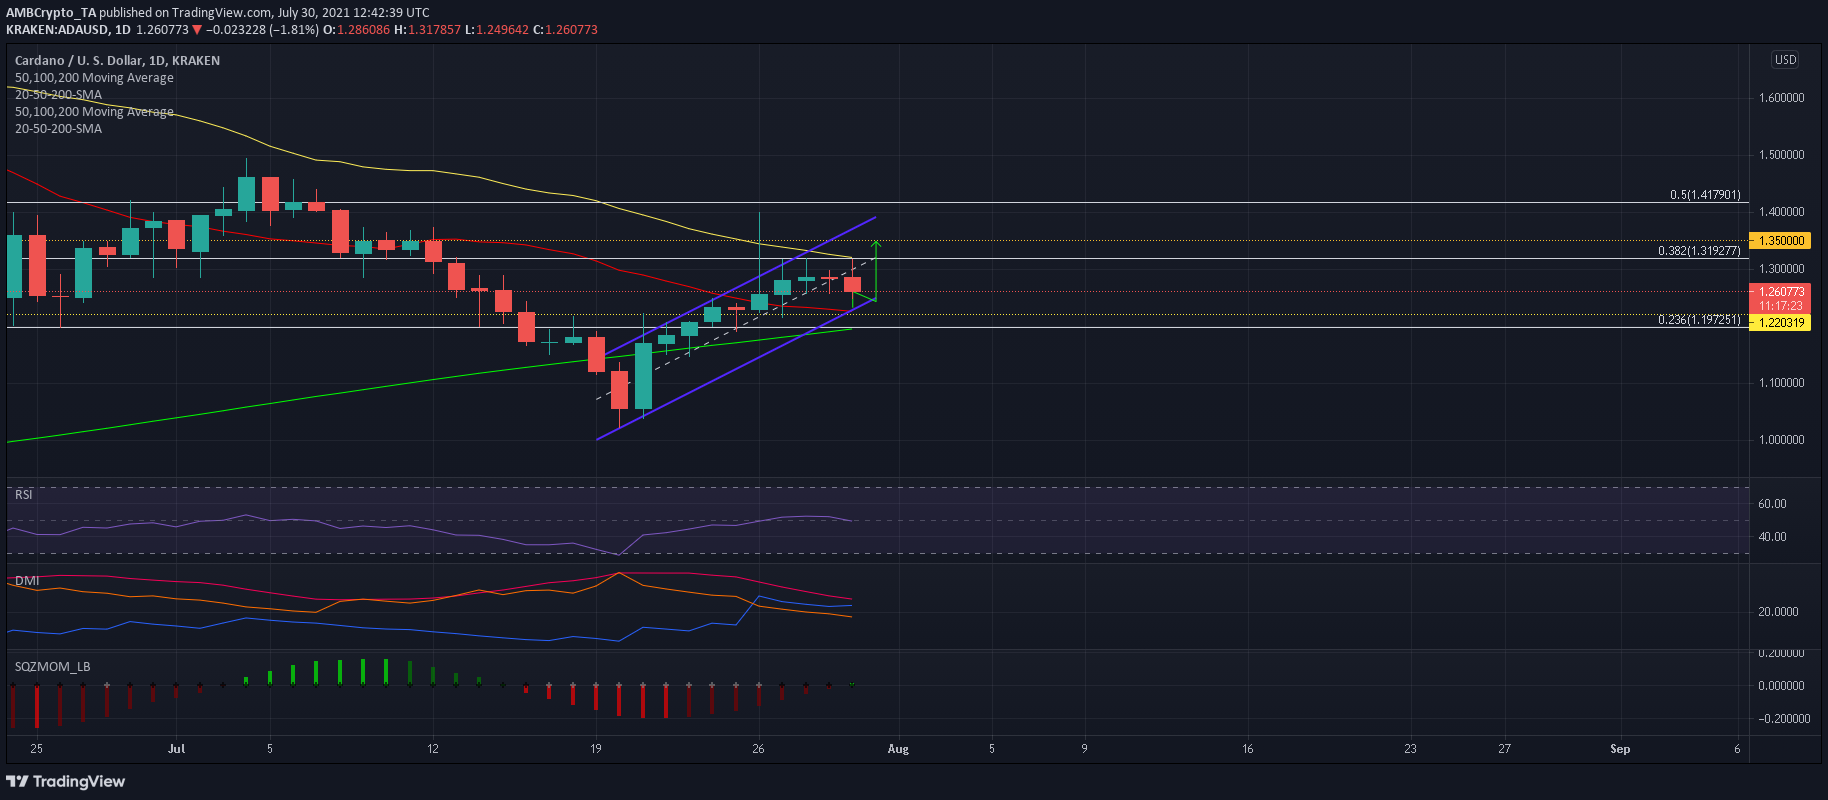
While ADA’s price has trended above the half-line of its channel over the past seven days and looked to break north from its pattern, the 38.2% Fibonacci Extension ($1.31) denied further upside.
A bit of selling pressure saw ADA drop below the half-line and focus shifted back to the lower trendline, one which coincided with the 20-SMA (red). Interestingly, 18 July’s swing high of $1.21 also clashed with the aforementioned zone. This is an important area to maintain for bullish control. In case of a close below $1.21, a stronger retracement can be expected.
Reasoning
The Relative Strength Index hovered around neutral territory, but was pointing south at press time. If selling pressure rises over the coming hours, the index would likely drop into bearish territory between 45-40.
The Directional Movement Index’s +DI and -DI were in close proximity, but a bullish trend maintained itself. The ADX seemed to dip below 25, something that negated chances of an immediate breakdown from the pattern. Moreover, the Squeeze Momentum Indicator suggested that bearish momentum was on a decline. However, it reflected an ongoing ‘market squeeze.’
Conclusion
There was a lack of a clear trend in the Cardano market, but bearish momentum was receding. A fall towards the lower trendline and the 20-SMA present around $1.21-1.22 would be the ideal long entry for traders looking to capitalize on the next upswing. Although it is too early to predict whether ADA would break north from its pattern, a safe take-profit can be set at $1.35.