Cardano, MANA, VeChain Price Analysis: 23 December

While the market definitely showed some recovery signs over the last three days, Cardano and VeChain snapped off their long-term trendline resistance and reversed their trends. However, Cardano needed more volumes to confirm a stronger trend.
Decentraland found a traversing range after flashing a slight bearish preference.
Cardano (ADA)
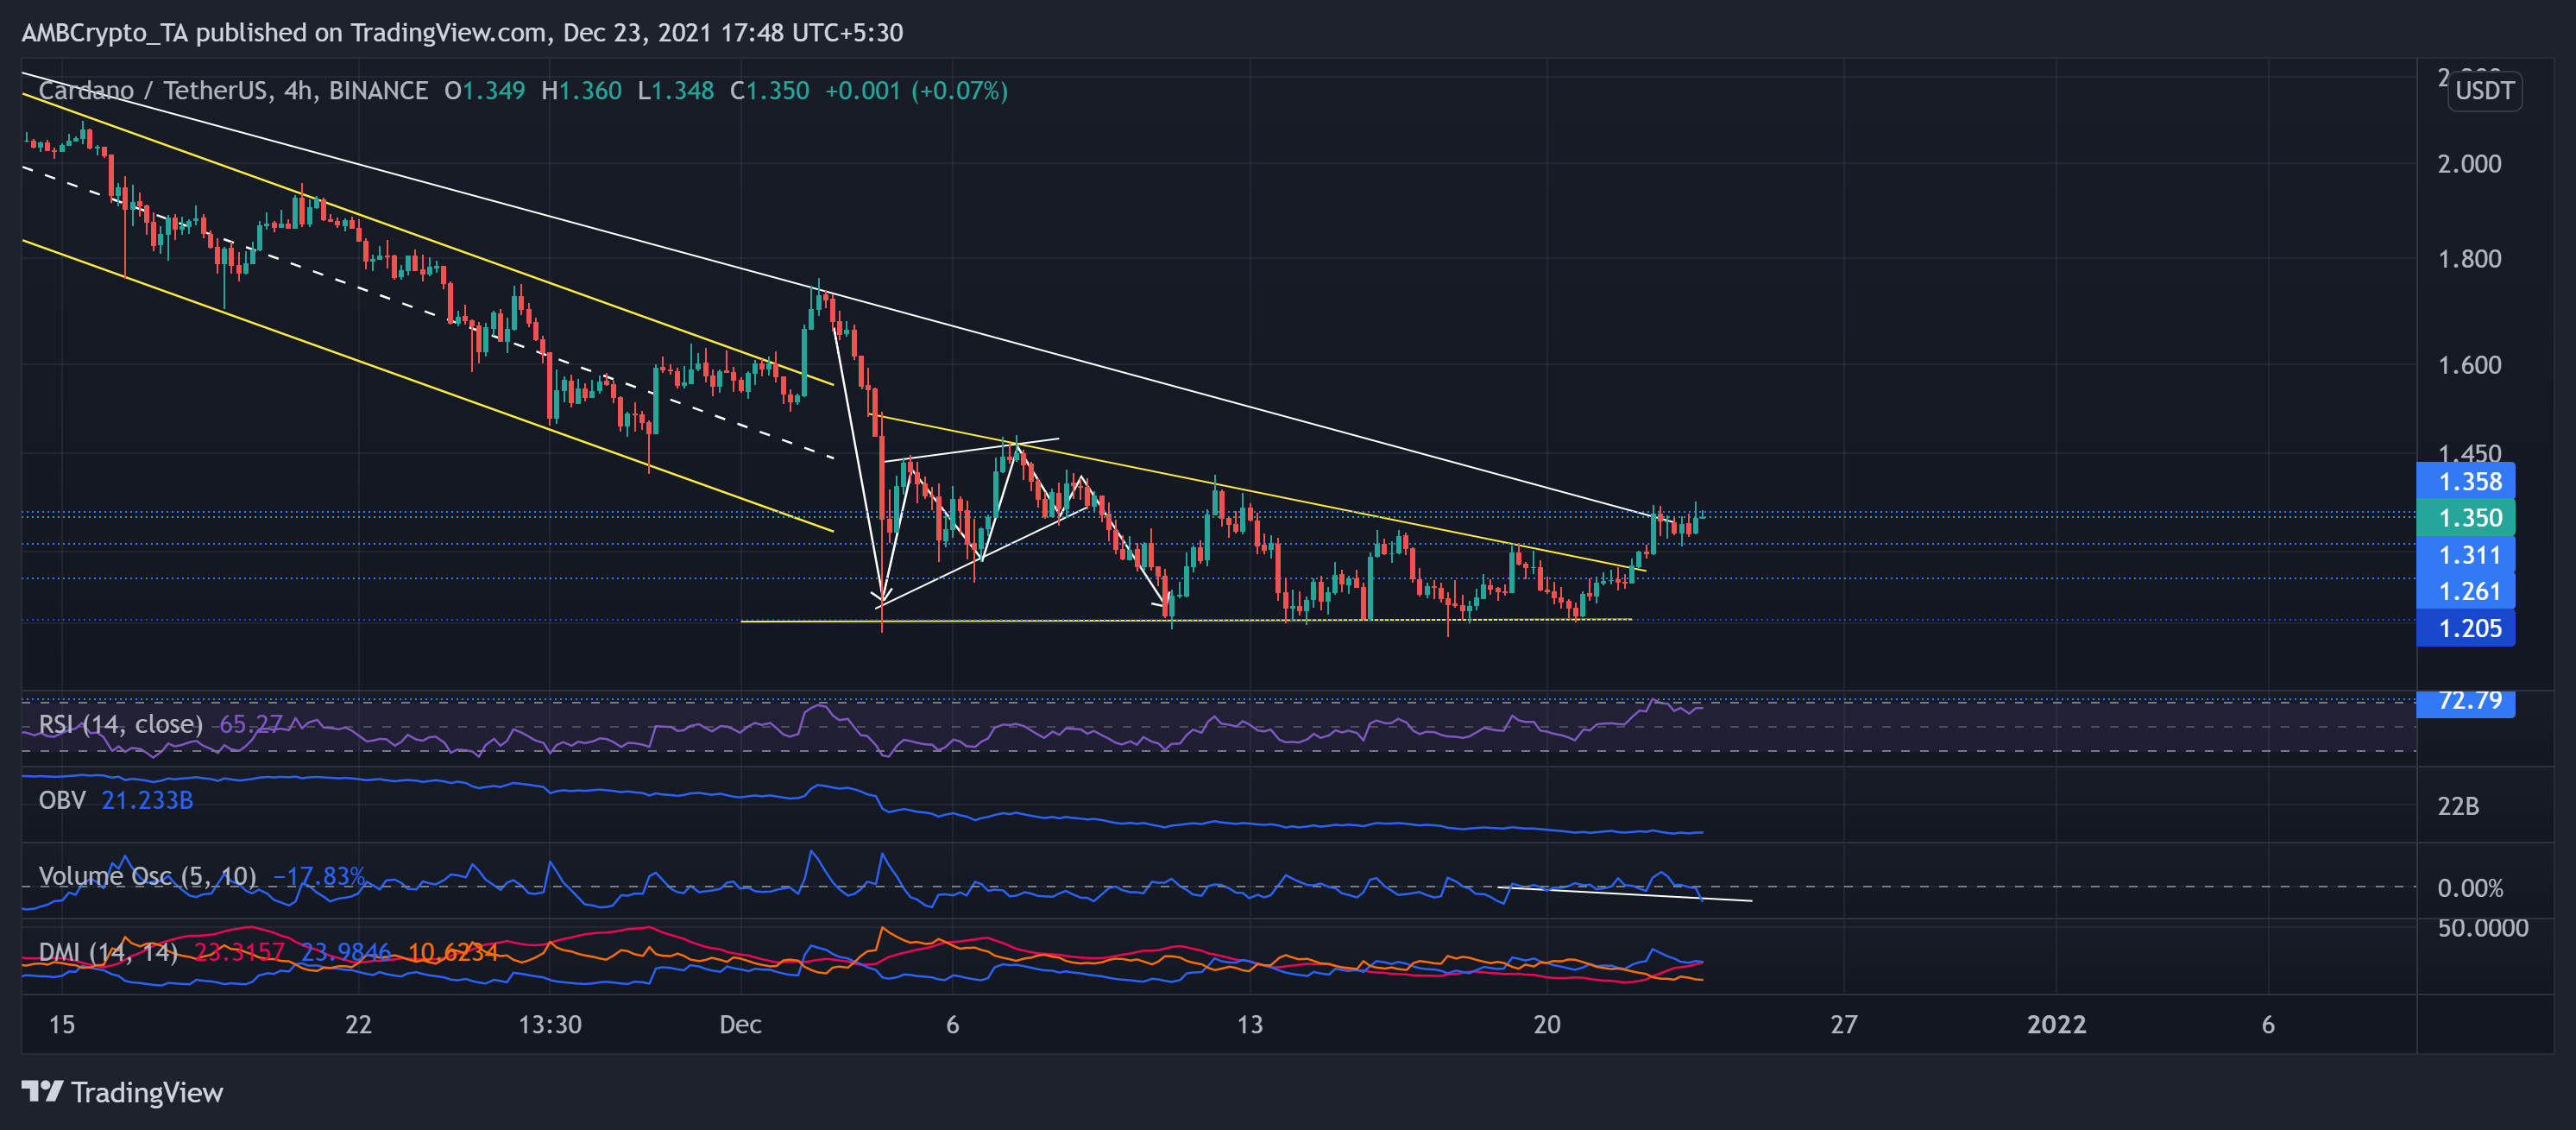
Just when most investors lost hope, ADA bulls did not dwindle, and upheld the 21-week support at the $1.2-mark.
The price action bounced back from this level and invalidated the bearish tendencies of a descending triangle formed throughout this month. This incline also breached the longer timeframe trendline resistance (White, since 9 November).
In terms of the strength of its trend, the OBV did not depict a remarkable surge yet. Moreover, the Volume oscillator saw lower lows, indicating a less likelihood of a sweeping trend alternation.
At press time, ADA traded at $1.35. Now, the price action found immediate testing support at the $1.31-mark. The RSI skewed in favor of bulls after poking its six-week high on 22 December. Also, the DMI resonated with the RSI but displayed a weak directional trend.
Decentraland (MANA)

MANA halted its downturn at the $3.02-mark (one-month support) as the alt saw a persistent decline after striking its ATH on 25 November. The bearish pennant breakout transposed into a down-channel after the alt noted a 25.83% decline from 7 to 15 December.
Now, the metaverse token has found an oscillating range between the $3.43 and $3.02-mark. Even so, the price action swayed below all the EMA ribbons, indicating a marginal bearish preference.
At press time, MANA traded 44.3% below its ATH at $3.2391. The RSI was at the 47-mark and showed neutral signs. While the DMI depicted a marginal selling preference, the ADX displayed an extremely weak directional trend.
VeChain (VET)
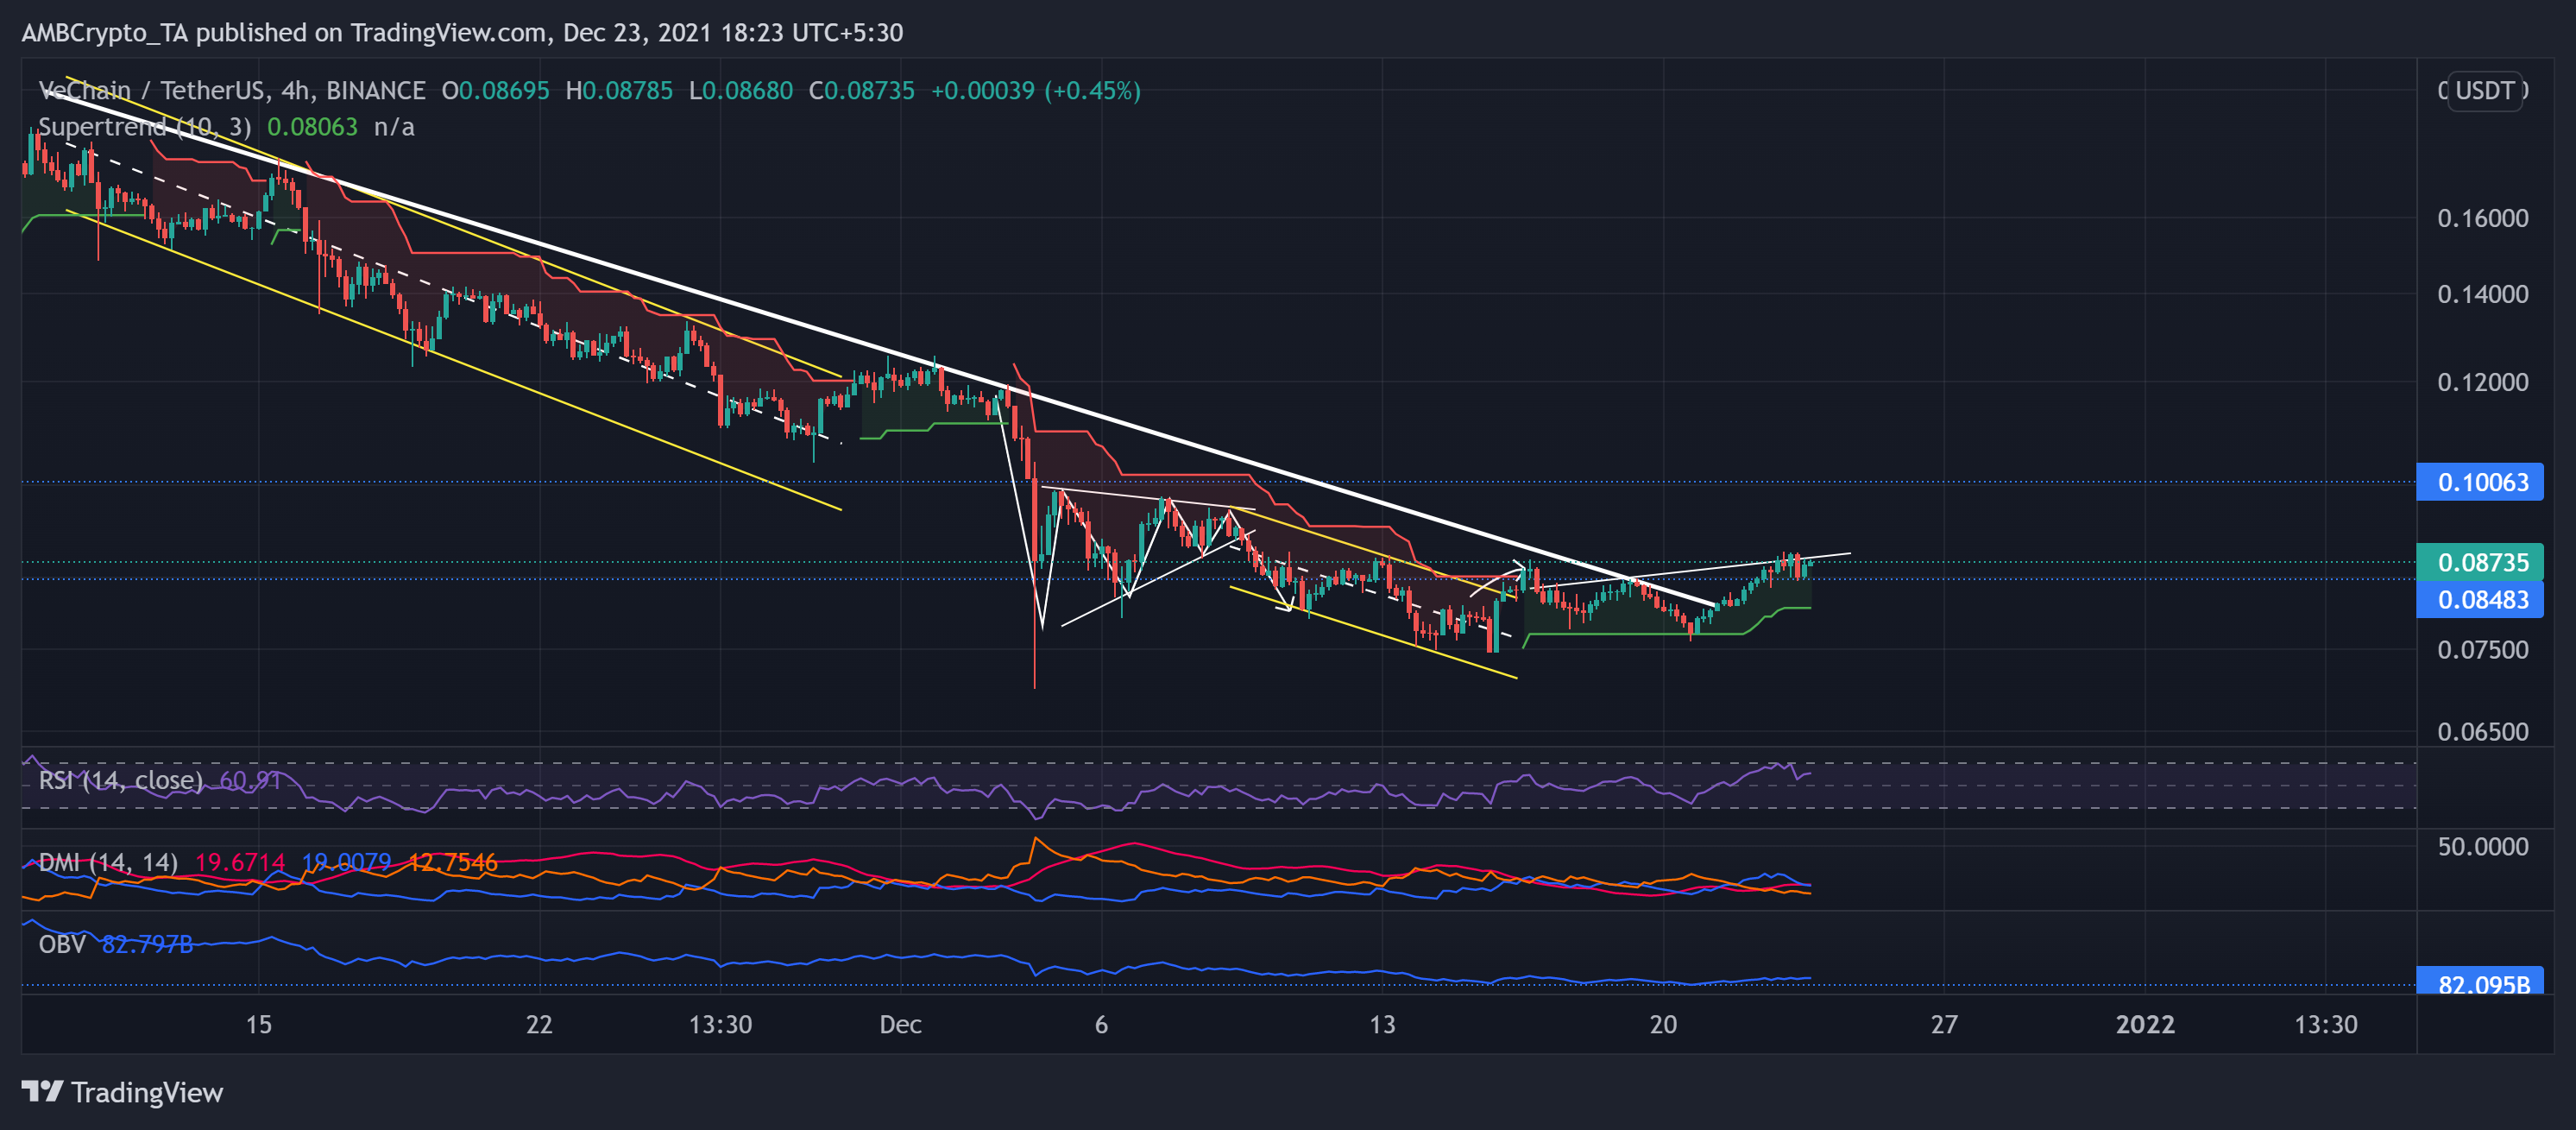
VET’s downturned after an expected bearish pennant breakout on 9 December that transposed into a down-channel.
Since 9 November, the altcoin saw a staggering 51.2% 30-day decline and disapproval of its long-term bullish trendline. This fall led the bears to breach the four-month-long bull resistance at the $0.084-mark.
However, the alt saw a 14.16% three-day jump as it broke above the $0.084-level. Like ADA, VET also breached its long-term trend resistance (white). At press time, the alt traded at $0.08735. The RSI was in an uptrend and chose the buying power.
The Supertrend flashed buy signals while the OBV corresponded with the increased price action. Also, the DMI lines confirmed the bullish outlook while the ADX displayed a weak directional trend.


