Cardano, Polkadot, Tron Price Analysis: 25 October

Cryptocurrencies traded in the green earlier today. Bitcoin dipped slightly from its new all-time high and hovered around $62,000, at the time of writing. Major altcoins like Polkadot and Tron sounded a bullish bugle.
However, Cardano shed value over the past day, and appeared to assume a bearish stance, in the near term.
Cardano (ADA)
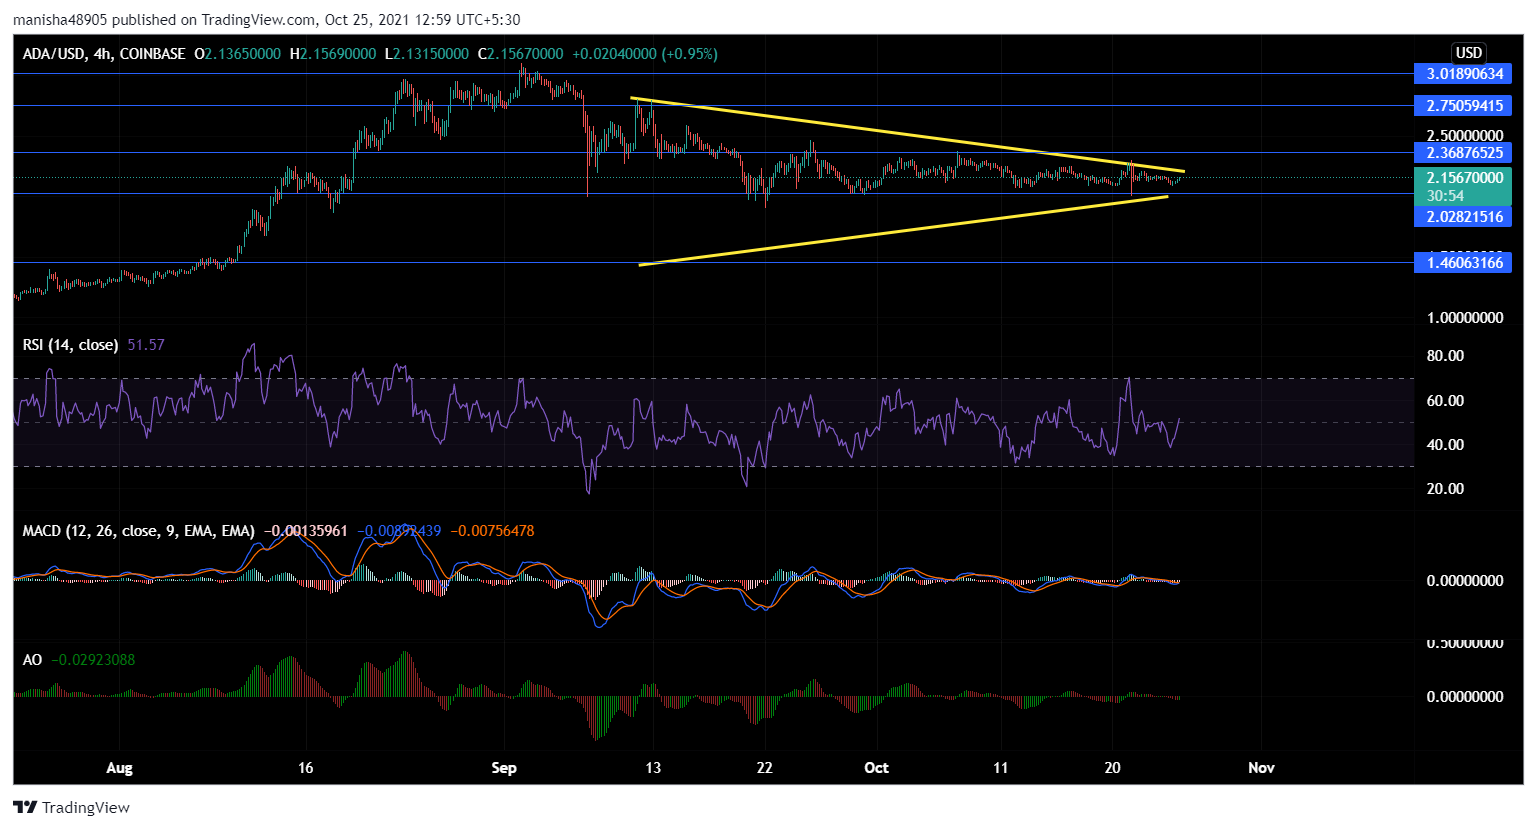
ADA’s price consolidated on its 4-hour chart as it traded sideways and registered a 0.20% drop at the time of analysis. Trading within the confines of a symmetrical triangle, ADA seemed to be approaching its immediate support level at $2.01.
A shift below its floor would mean bears overtaking bulls to bring it further down to its long-term support at $1.46. Conversely, $2.36 and $2.75 would need to be overturned if bulls are to take control of proceedings.
The Relative Strength Index (RSI) stood near the 48-mark, witnessing a brief spike towards the oversold territory. This depicted that the price was starting to lose momentum. The RSI also highlighted a huge accumulation range, potentially setting it up for another bullish move towards the end of the year if BTC and ETH continue on their bullish path.
MACD also approached a bearish divergence heading downward. This indicated that bears were able to sway the market. The Awesome Oscillator flashed weakening red signal bars on its histogram, perhaps suggesting that the buyers should wait for a little while.
Polkadot (DOT)
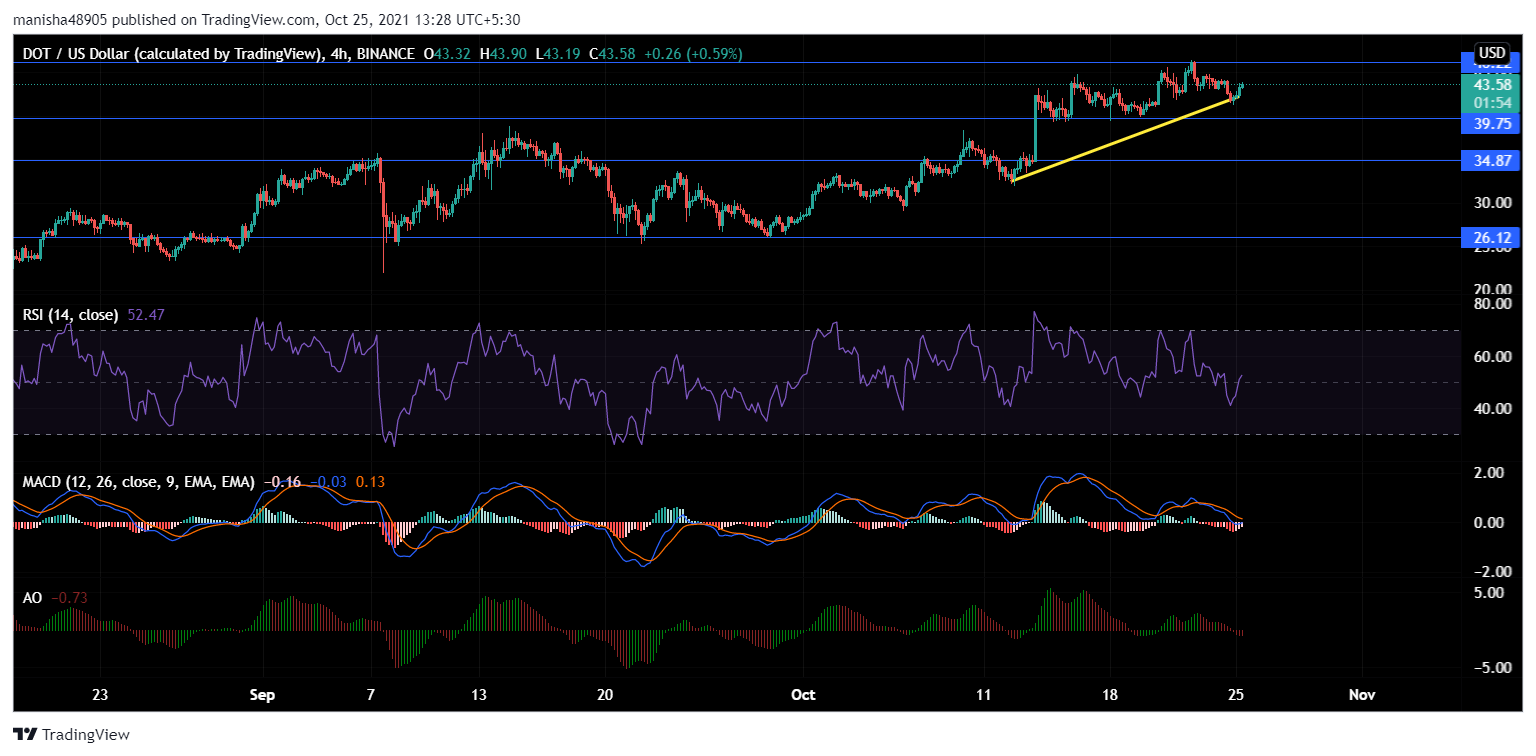
DOT has carried forward a bullish outlook since commencing an upwards run from $26.12 in late September. At the time of writing, it registered an increase of 0.34% to $43.81. If DOT continues its northward pace, it might breach its immediate resistance at $45.50.
However, an unwarranted bearish intervention could give way to an opposite movement which will find strong support at $39.75 and $34.87 respectively. RSI rested above the middle line near the 54-mark. It further appeared to go northwards, hinting that the future price movements might push it to the overbought zone.
MACD (blue line) gave bearish signs as it rested below the signal line (orange), thus giving strong hint to sellers. Awesome Oscillator fell in line with MACD as it flashed red signal bars which were receding in size. However, a macro view indicated that DOT’s long-term outlook was heavily in favor of the bulls.
TRON (TRX)
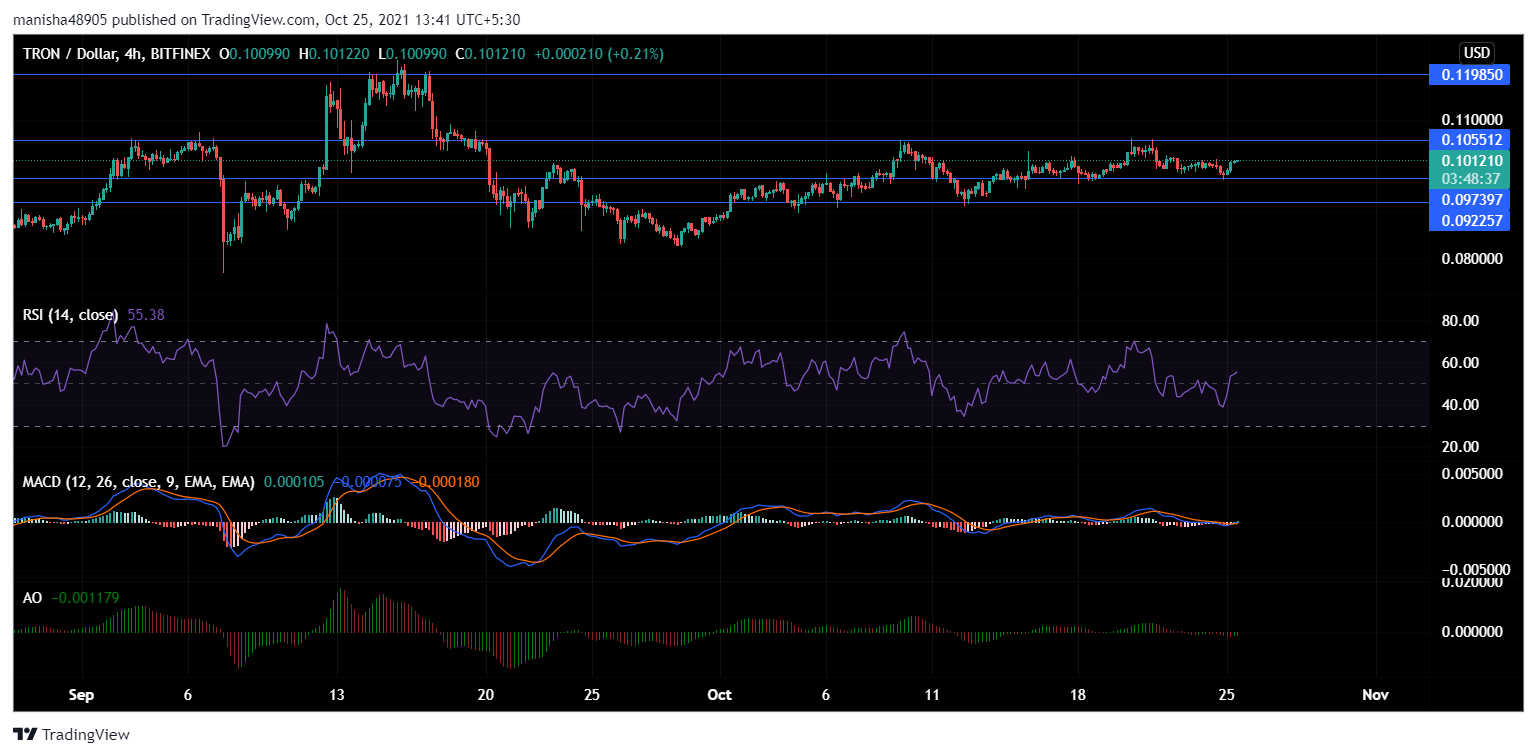
With a notable 0.87% rise, TRX was trading at $0.101, at press time. It appeared to be in for consolidation on its 4-hour chart. If the bulls keep helping TRX, the price will break past its immediate resistance level at $0.105 to reach its long-term resistance at $0.120.
Conversely, bears might see TRX dipping low through near-term support of $0.097 to $0.091 if the price momentum turns negative in value. The RSI stood near the 55-mark aiming to breach a 70-mark and enter the overbought zone. In that case, a trend reversal will soon follow.
However, its recent mark indicates that buyers might consider the market favorable but with a little caution in the fore. MACD and Awesome Oscillator flashed short red signal bars, implying that bulls might be in for some difficult days ahead.