Cardano, The Sandbox, Avalanche Price Analysis: 21 December

Bitcoin’s bounce from its low timeframe range lows has dragged the market upward in the past couple of days. Avalanche posted a strong recovery from its performance earlier this month when it saw some accumulation occur in the $80 region. Cardano formed a triangle pattern and could begin to move upward, following the market’s trend in the past two days. The Sandbox faced strong resistance at $5.3.
Cardano (ADA)
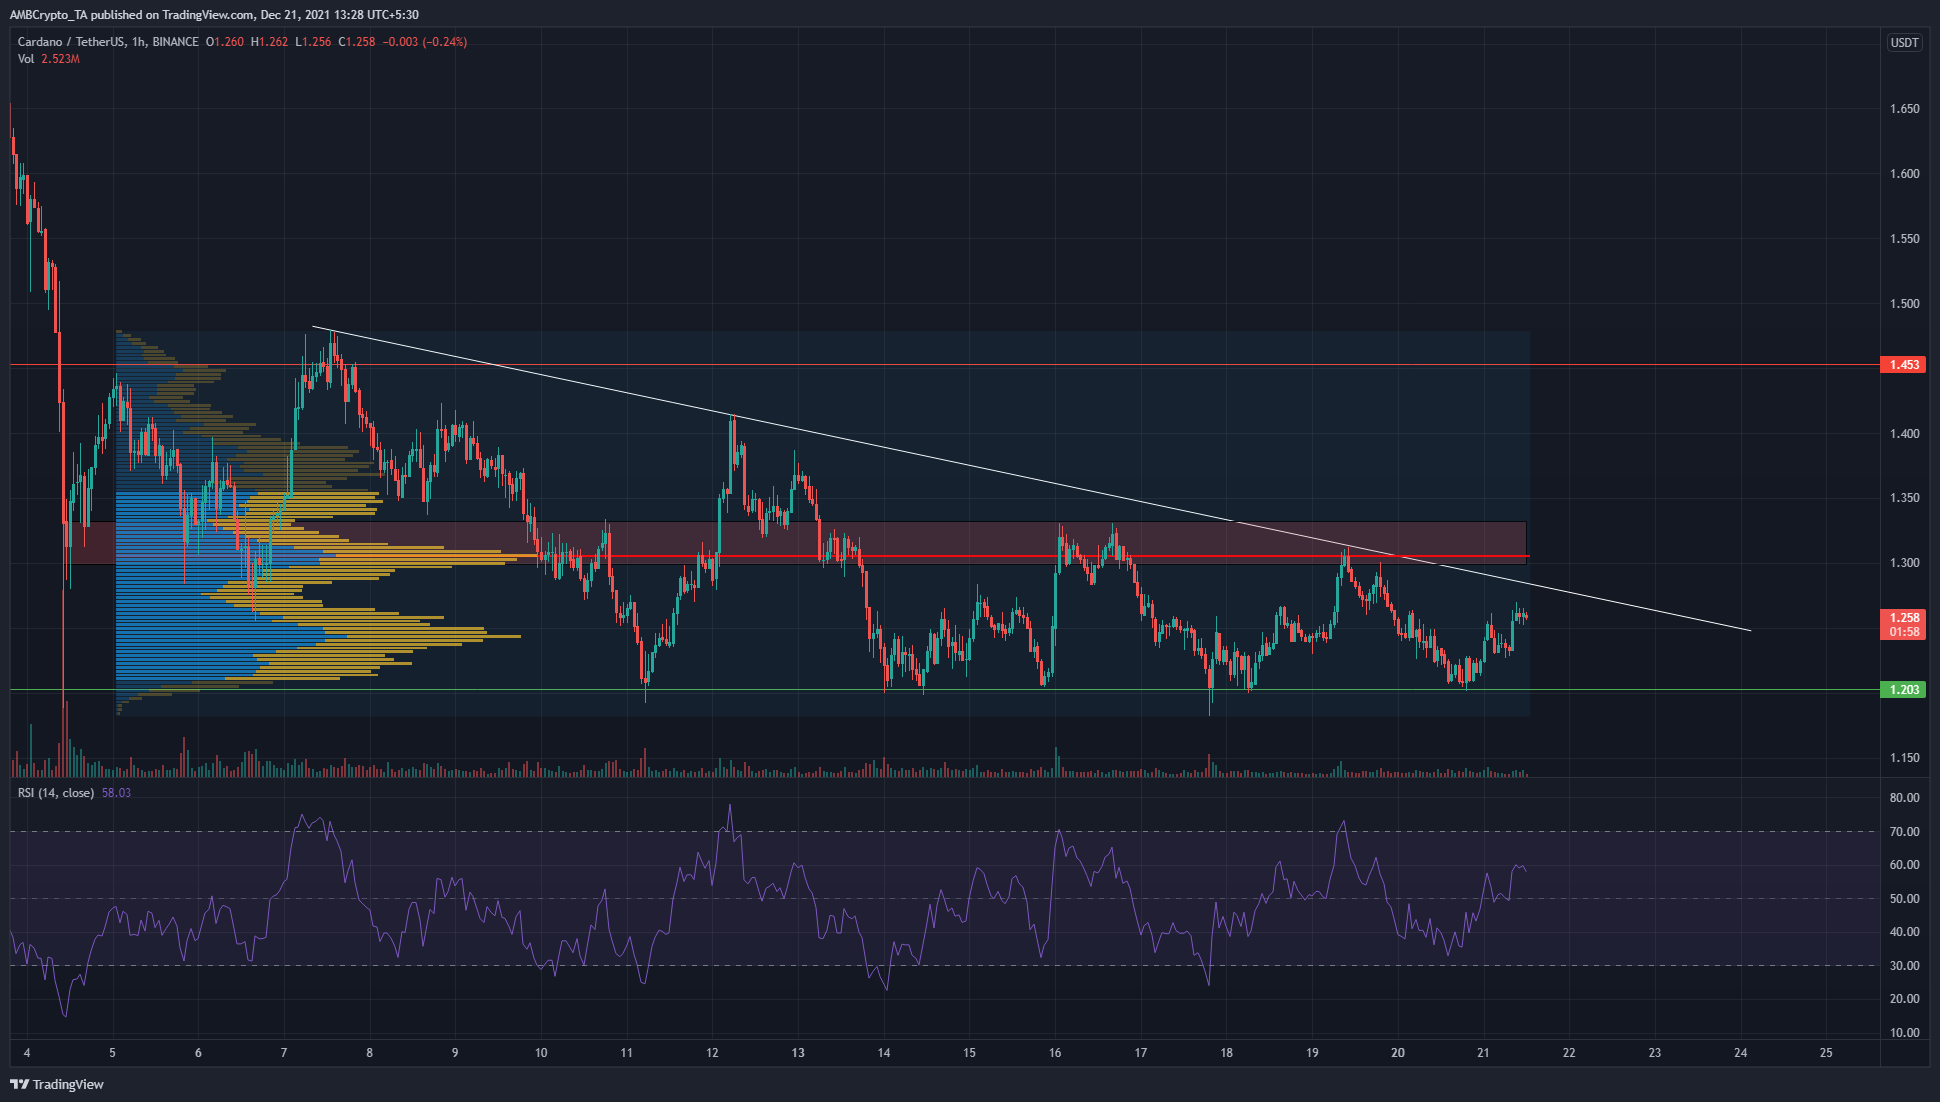
The $1.2 support level has been tested multiple times over the past two weeks. Along with the support, the price also made a series of lower highs and the price has not yet broken above the trendline resistance. This triangle pattern could see an ADA breakout in either direction, likely following Bitcoin.
There is a strong zone of supply at the $1.3-$1.33. The Fixed Range Volume Profile plotted from early December also showed the Point of Control to be at $1.3, marking it out once again as a strong resistance.
The RSI flipped neutral 50 to support and climbed higher to show bullish momentum.
The Sandbox (SAND)

The two sets of Fibonacci retracement levels were plotted to the same swing low at $4.12 (December 4 selloff) and showed some confluence at the $6.4-$6.5 area. They also marked levels to watch out for in the $4.85-$5.58 area.
The price flipped the $5.02 level to support and climbed toward the upper Bollinger band, while the MACD also climbed past the zero line to indicate bullish momentum on the hourly chart.
Over the past two days, the price has bounced between $5.3 and $4.73, forming a low timeframe range. Flipping the range highs to support will likely indicate further upside for SAND.
Avalanche (AVAX)
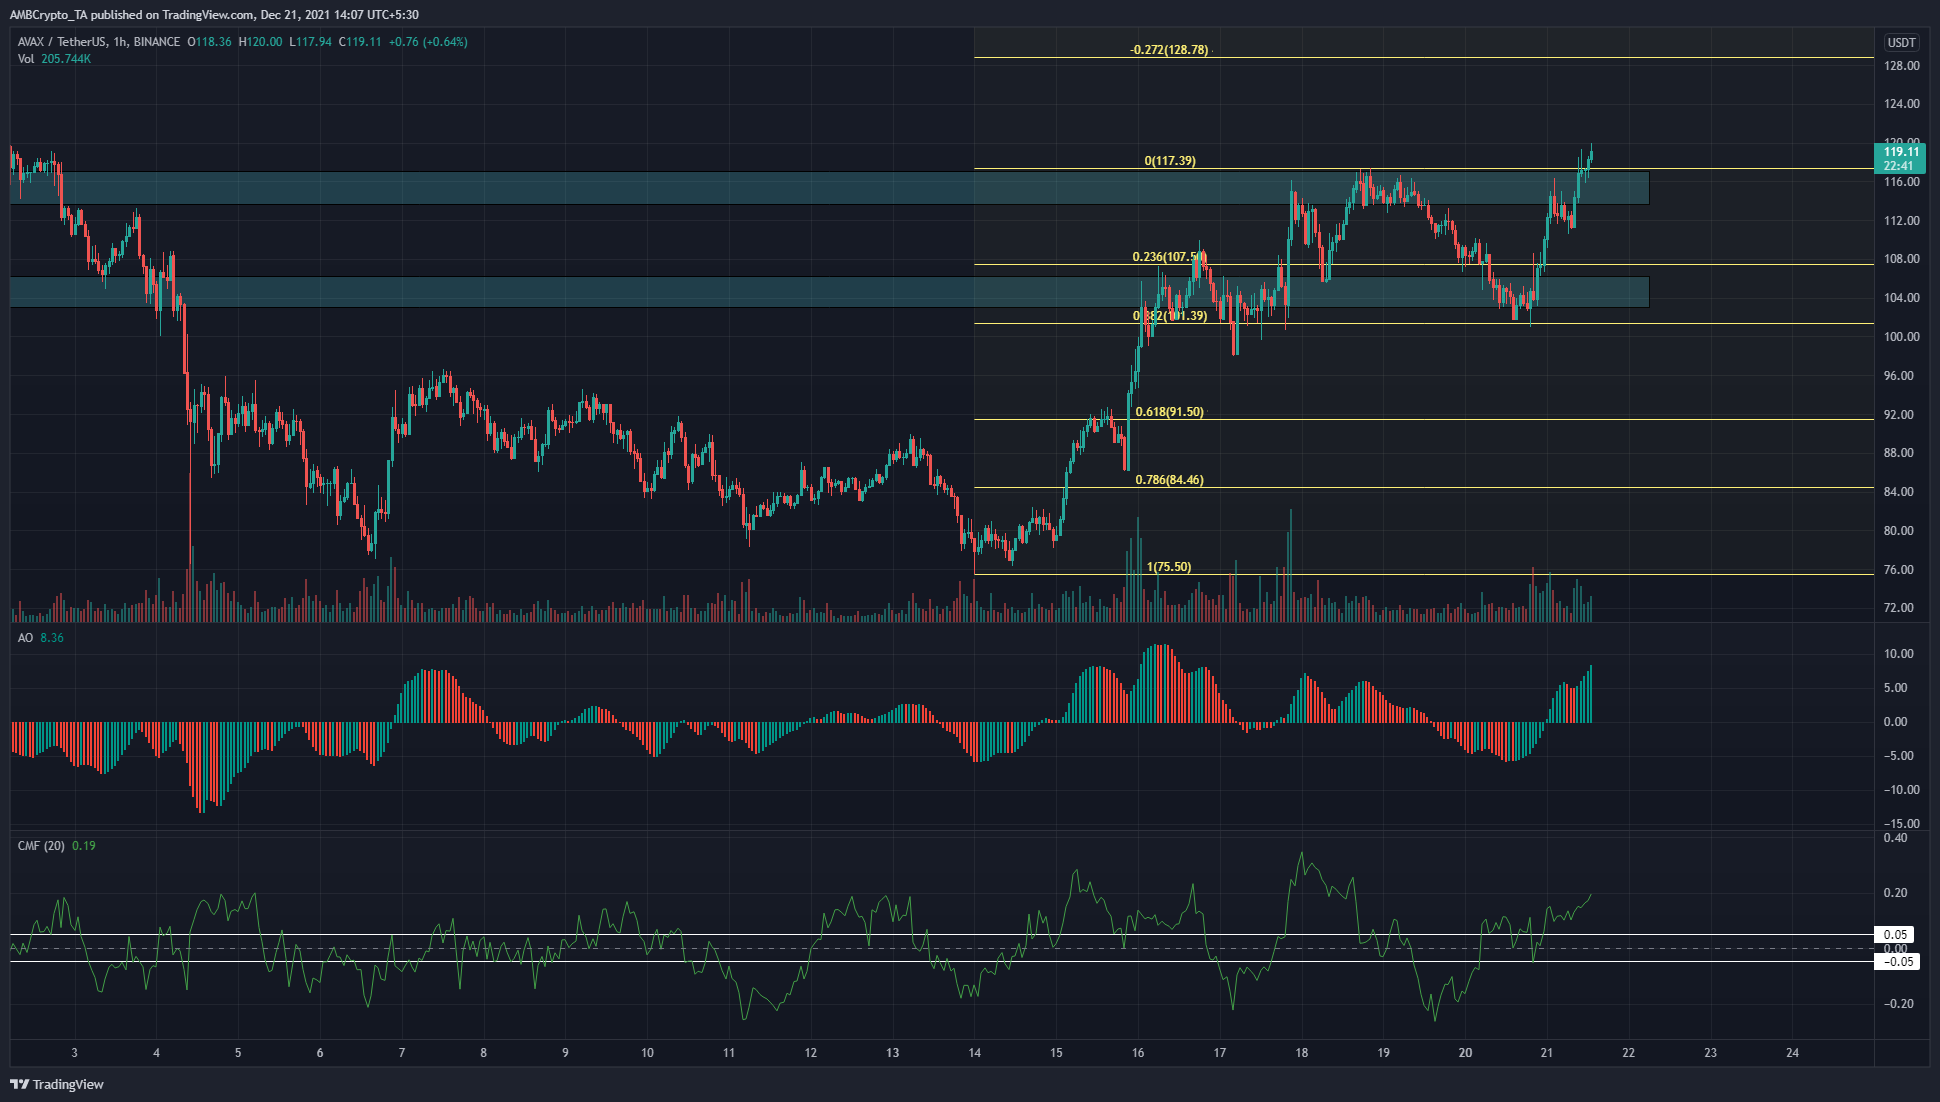
AVAX continues to be one of the stronger coins in the market. It stagnated for a couple of weeks in December under the $95 mark but has since climbed above the $103 area and flipped it to an area of demand. This show of strength saw sidelined traders step in as buyers.
The price also broke past the $117 mark, after facing selling pressure there in the past few days. This move upward could rise to the 27.2% extension level at $128.78, or reach as high as the 61.8% extension at $143.28 before seeing a pullback.
The Awesome Oscillator showed strong bullish momentum, and the CMF was above +0.05 to indicate buyer dominance on the hourly chart.


