Cardano: These levels could determine ADA’s recovery prospects

Disclaimer: The findings of the following analysis are the sole opinions of the writer and should not be considered investment advice.
For over a week, the one-month trendline resistance (white, dashed) and the 50% Fibonacci level have created a stiff buying hurdle. As a result, Cardano’s [ADA] flip from the $0.48-level aided the sellers in imposing an ascending broadening wedge breakdown.
The broader outlook exhibited bearishness, especially after ADA failed to sustain above the 20/50/200 EMA in the 4-hour timeframe. A continued plunge from the pattern could pull the alt to retest its long-term support. At press time, ADA was trading at $0.4549.
ADA 4-hour Chart
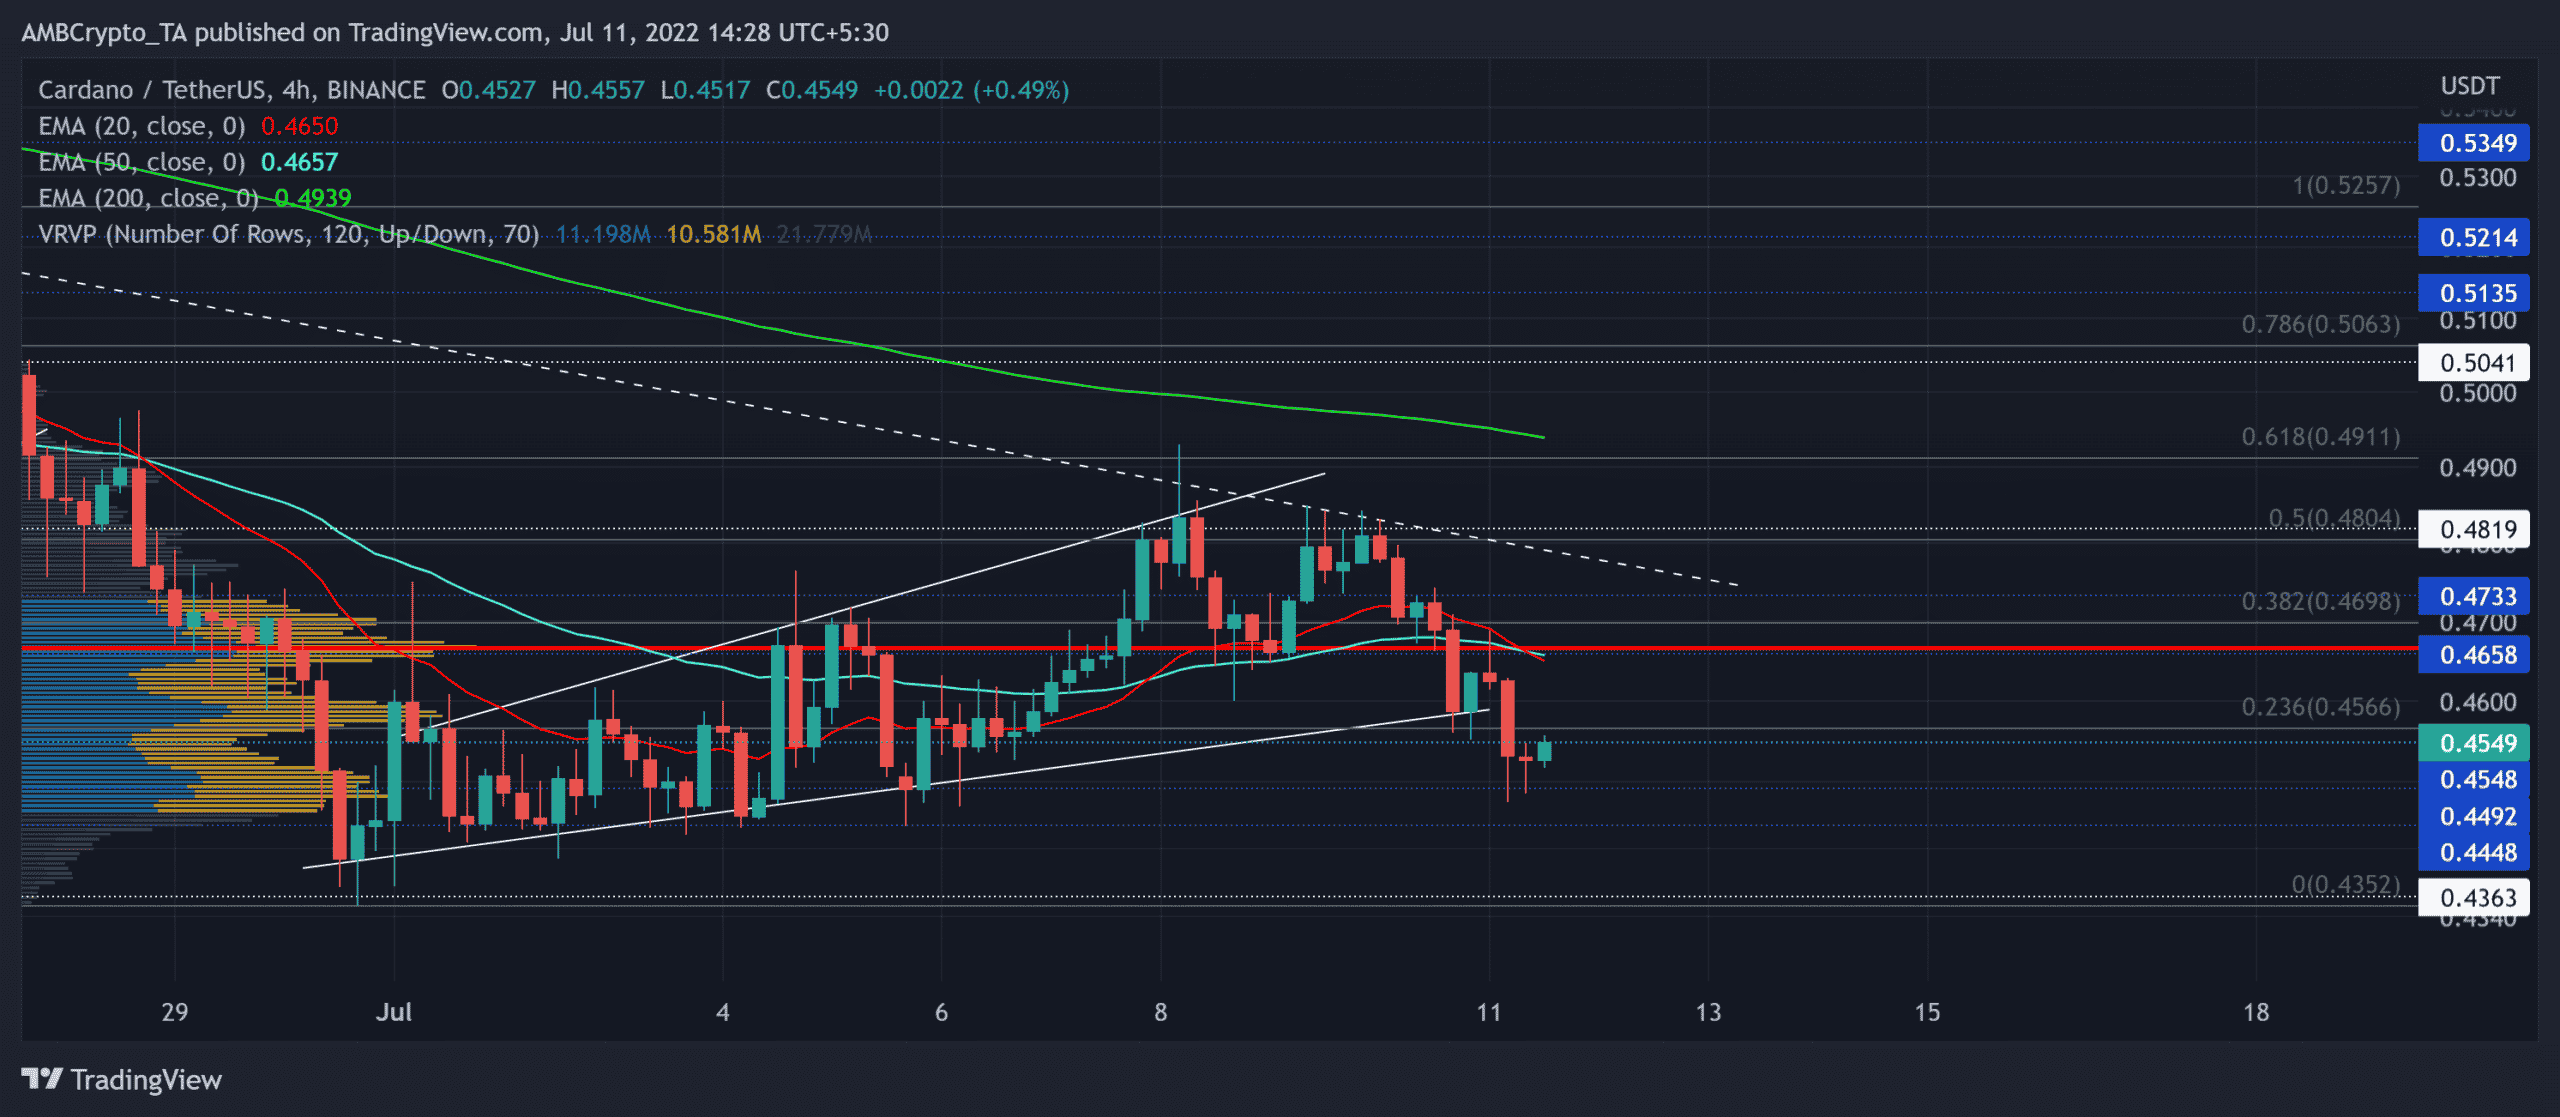
As the 20 EMA (red) fell below the 50 EMA (cyan), the near-term narrative for the altcoin took a bearish stance. The trendline resistance has shunned the recent bullish efforts to reclaim critical support levels.
Further, the price action saw a break below the broadening wedge whilst the EMAs still looked south. A consistent bearish pull could help the sellers retest the $0.43-$0.44 range in the coming sessions.
However, the price action now entered into a relatively high liquidity region. So, an inability to inflict a robust bearish, or bullish move could extend the sluggish phase on the chart.
With the rejection of higher prices evidenced by a bearish hammer, the bears could steer the near-term trend. An immediate buying resurgence above the Point of Control (POC, red) could shun the bearish tendencies. Here, the trendline resistance could constrict the bullish efforts.
Rationale
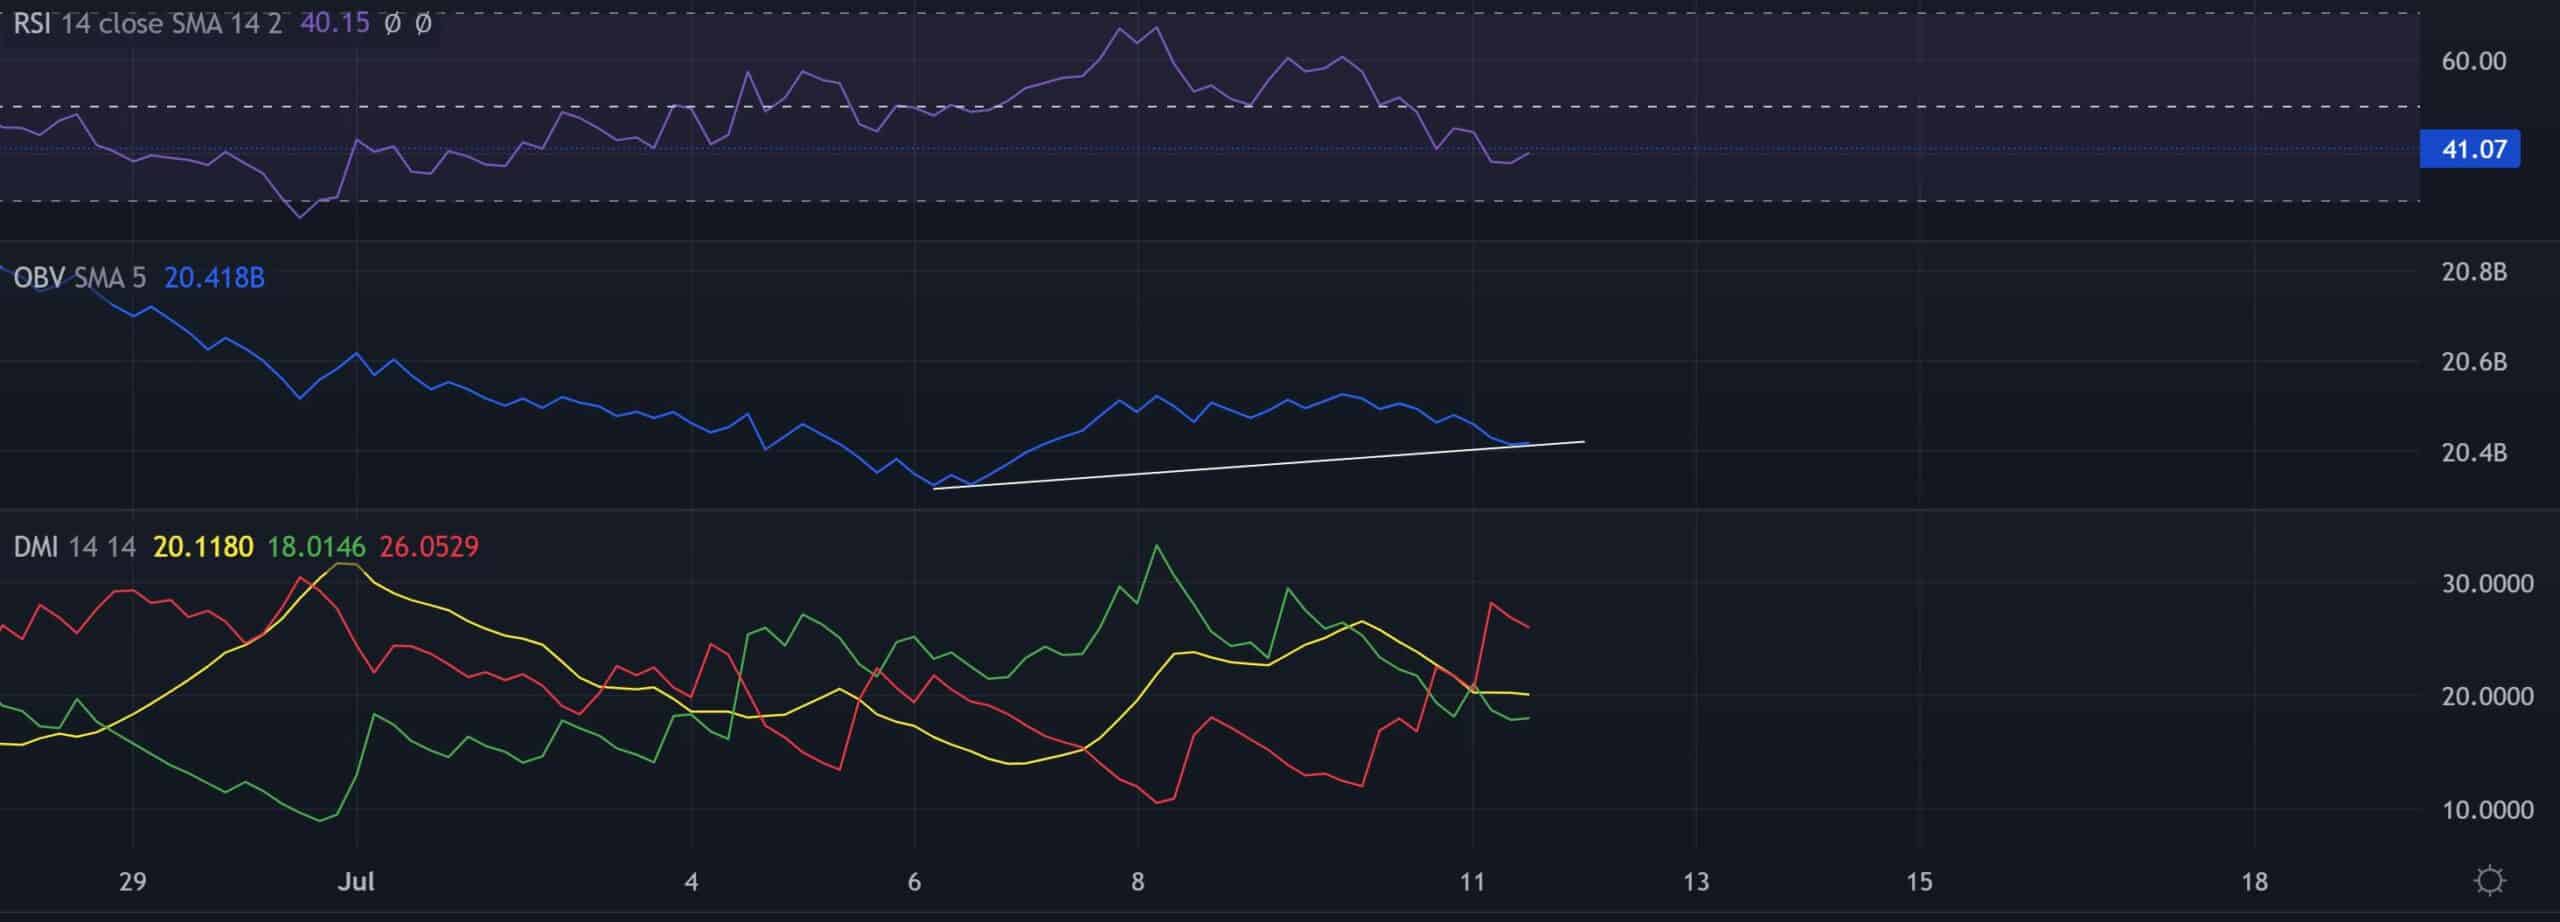
The Relative Strength Index took a bearish outlook hovering below the 41-resistance. A breach above this support could aid the buyers in easing the selling pressure.
Further, the OBV marked higher troughs over the last week and affirmed a slight increase in buying vigor. However, the price action marked lower lows during this time. So, any reversals on the OBV could confirm a bullish divergence.
Nevertheless, the Directional Movement Index (DMI) exhibited a bearish stance. But the ADX of ADA revealed a weak directional trend.
Conclusion
With sellers finding a break below the pattern and the bearish crossover on the EMAs, ADA could continue its bearish movements. But the indicators exhibited mixed signs in the 4-hour timeframe. The targets would remain the same as above.
Finally, traders/investors should keep a close watch on Bitcoin’s movement and its effects on the wider market to make a profitable move.


