Cardano: This region has the potential to trigger a breakout

Cardano’s roadmap towards its Alonzo mainnet includes a gradual transition from color-coded testnets but the same has been facing issues lately. The transition from Alonzo blue to Alonzo white has had its fair share of problems, something pointed out by the technology manager at IOHK.
The sentiment did not do any favors to Cardano’s native cryptocurrency ADA, but a broader market recovery did drag prices out of the red zone. At the time of writing, ADA traded at $1.20, up by a marginal 0.14% over the last 24 hours.
Cardano Daily Chart
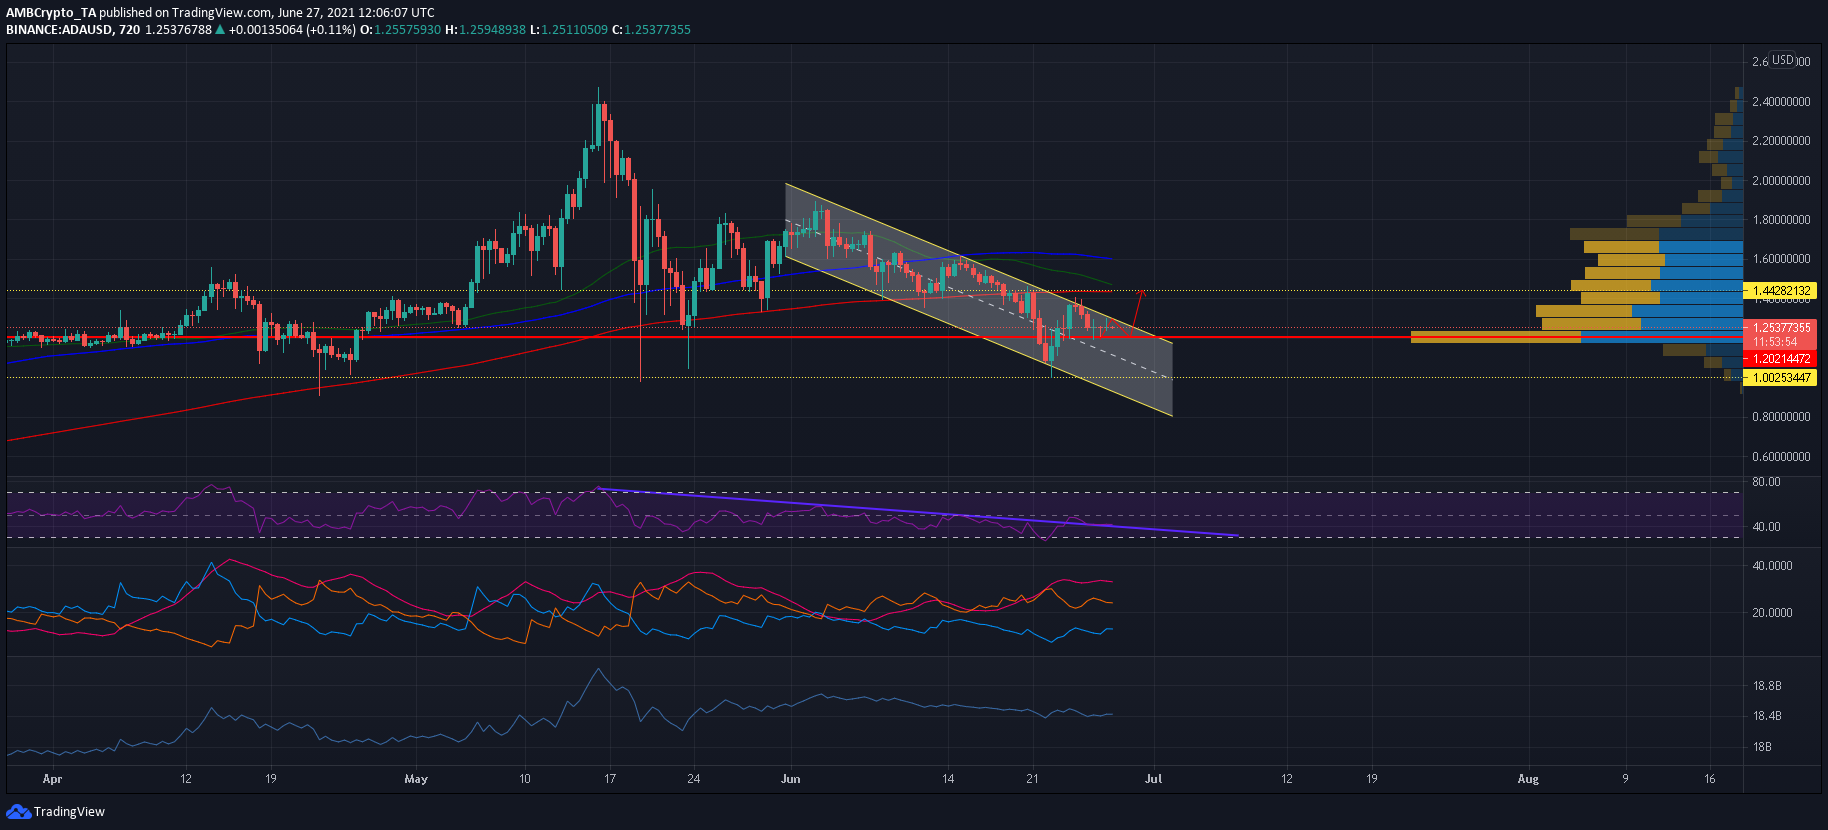
ADA’s reversal on 22 June was an important one as bulls avoided a breakdown below its 19 May low of $0.97. A recovery soon followed as gains amounted to 40% over the next four days but the 20-SMA (green), which flipped bearish in early June, denied further upside. Since the attempted breakout above its long-term moving average, ADA has largely traded between $1.37 and $1.20- an area that has seen a large amount of interest for ADA according to the Visible Range profile.
The region did have the potential to trigger a breakout from ADA’s down-channel- an outcome that could push prices by 18% and towards the 200-MA (red) and $1.44 resistance. This resistance mark also clashed with daily 50-SMA and could deny an extended rise.
However, this did not mean that the ADA’s defense at $1.20 was impermeable to a breakdown. In fact, the lack of buying pressure could drag ADA’s down-channel back towards $1, where another reset was expected.
Reasoning
Relative Strength Index has moved within neutral territory over the past few days as bears were not able to fully assert control. Even the On Balance Volume noted a flat-like movement, suggesting that buying pressure has been able to match up to the selling pressure to a certain extent. Moreover, Directional Movement Index hinted at a potential shift of trend. The +DI line inched closer to -DI and a successful crossover would confirm a bullish stance.
Conclusion
ADA’s indicators were suggestive of a bullish revival within a support zone of $1.25-1.20. However, bulls had a small window to trigger a rise towards $1.44-resistance. If sellers return to the global cryptocurrency market over the coming days, there was a chance ADA could retrace all the way back towards $1.


