Cardano to $1 – Assessing if it is too much of a long shot

Cardano has only been shedding value of late. It is a known fact that this alt rarely rallies alongside other large-cap coins. Its historic not-so-high correlation with Bitcoin and Ethereum is a testament that the alt has decoupled itself somewhat from broader market trends.
After depreciating by 5% and 6.2% on the daily and weekly timeframes, the second-largest altcoin was trading at $2.1 at press time. So, after all that Alonzo hype, is Cardano’s price destined to go back below the $1-range?
Assessing the odds
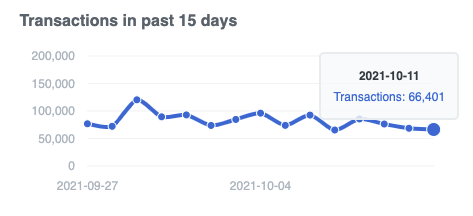
The state of the alt’s on-chain data has been quite discouraging of late. The number of transactions on the Cardano blockchain, for starters, has been falling lately. As per data from CardanoScan, the reading of this metric has shrunk by almost half [from 120k to 66k] since 29 September 2021.
The withering interest of market participants can additionally be depicted by the drop in active addresses and the average transfer value. A lower number of addresses interacting on the network underlines the inactive/hibernating state of ADA market participants.
Quite similarly, the state of the average transfer value ascertains the fall in the amount of ADA tokens exchanging hands between participants.
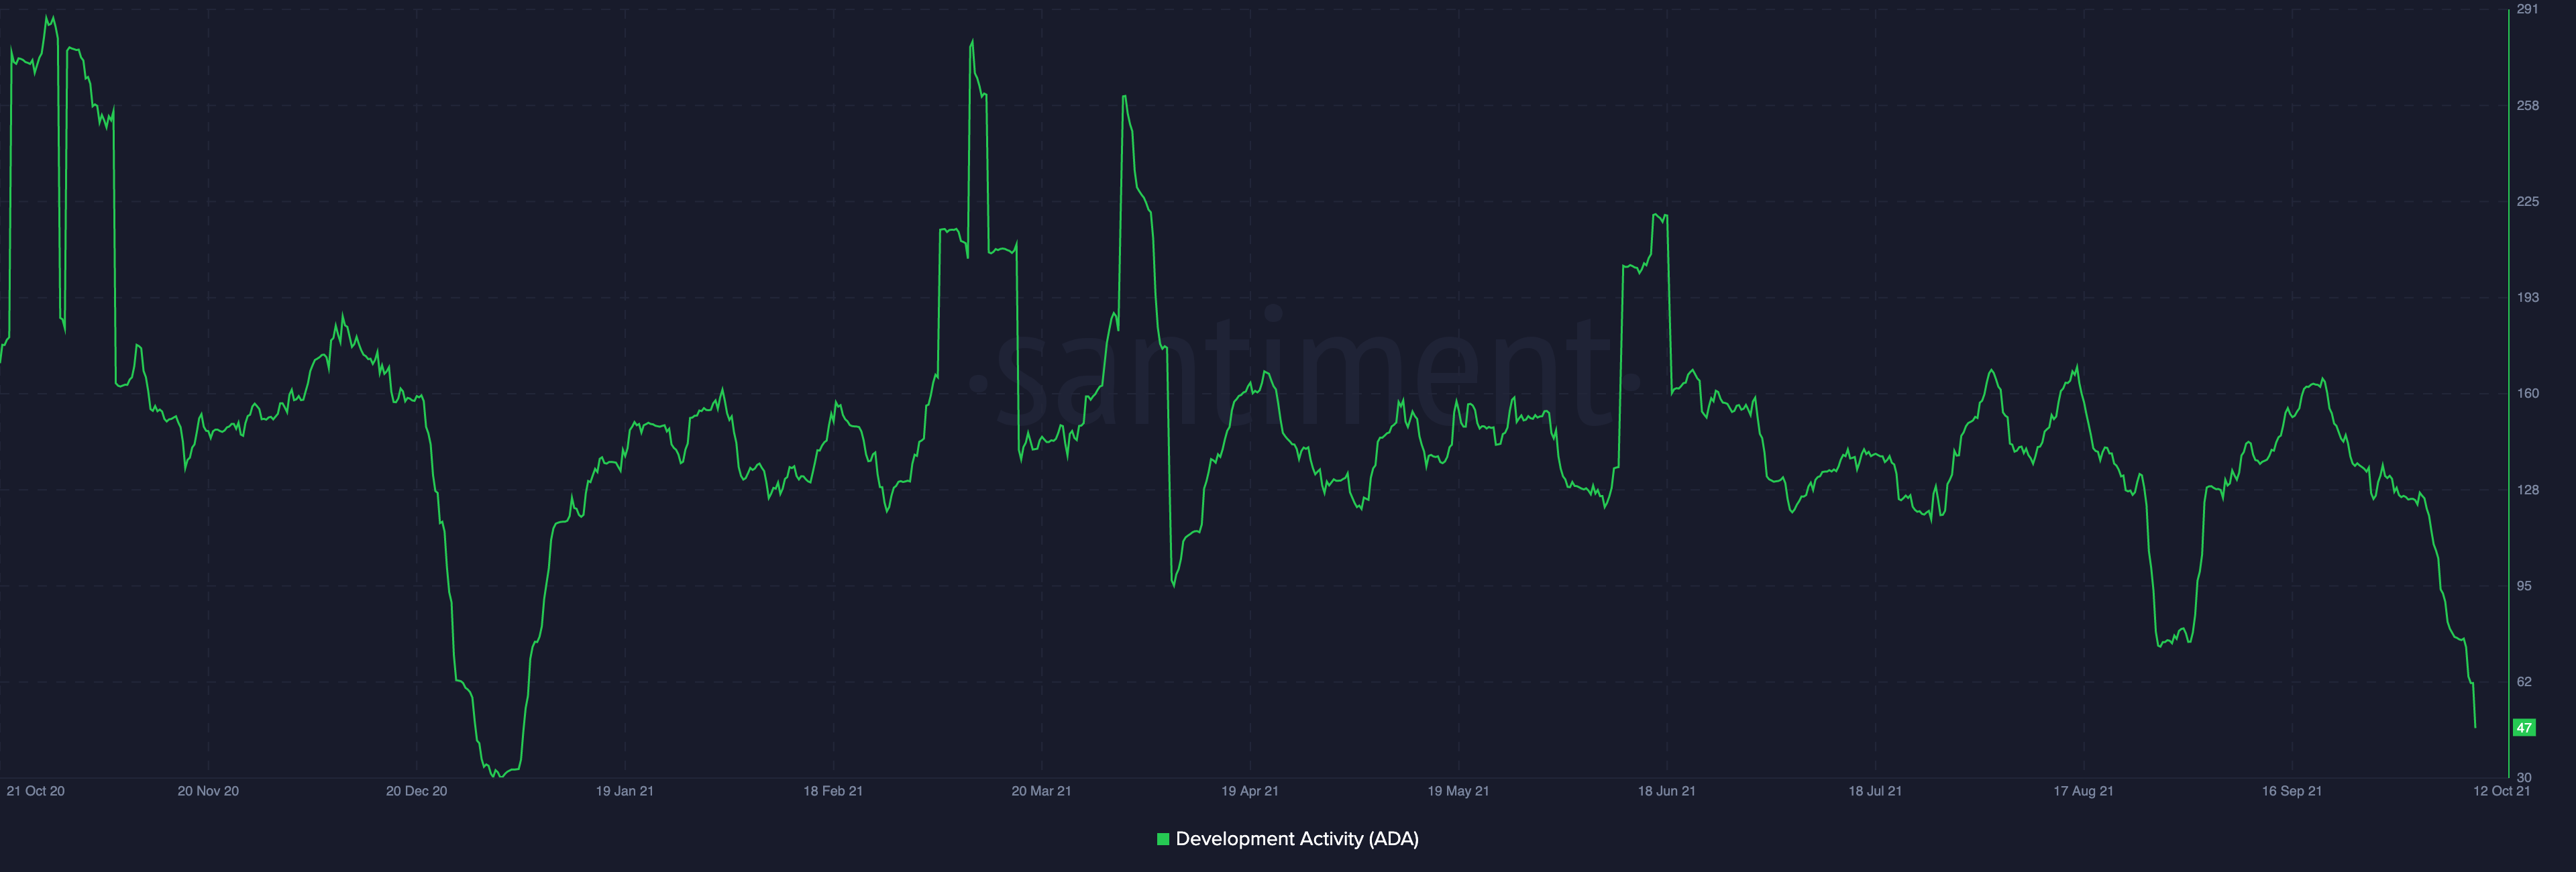
To make things worse, development activity, once Cardano’s strongest suit, has been in dire straits as well. In fact, according to the attached Santiment chart, such low levels were last observed back in December last year.
So, is the price drop likely?
On the price chart, Cardano has been trading inside a symmetrical triangle since the last few days of September. This pattern typically indicates a period of consolidation before the price breaks either up or down.
A breakdown from the lower trend line would mark the start of a new bearish trend while a breakout from the upper trendline would signify the start of a new bullish trend.
Now, as per the chart attached below, ADA’s price is currently hovering near the lower trendline of the triangle. Thus, if bears continue to assert dominance, the aforementioned support would be lost and bearish sentiments would gain steam.
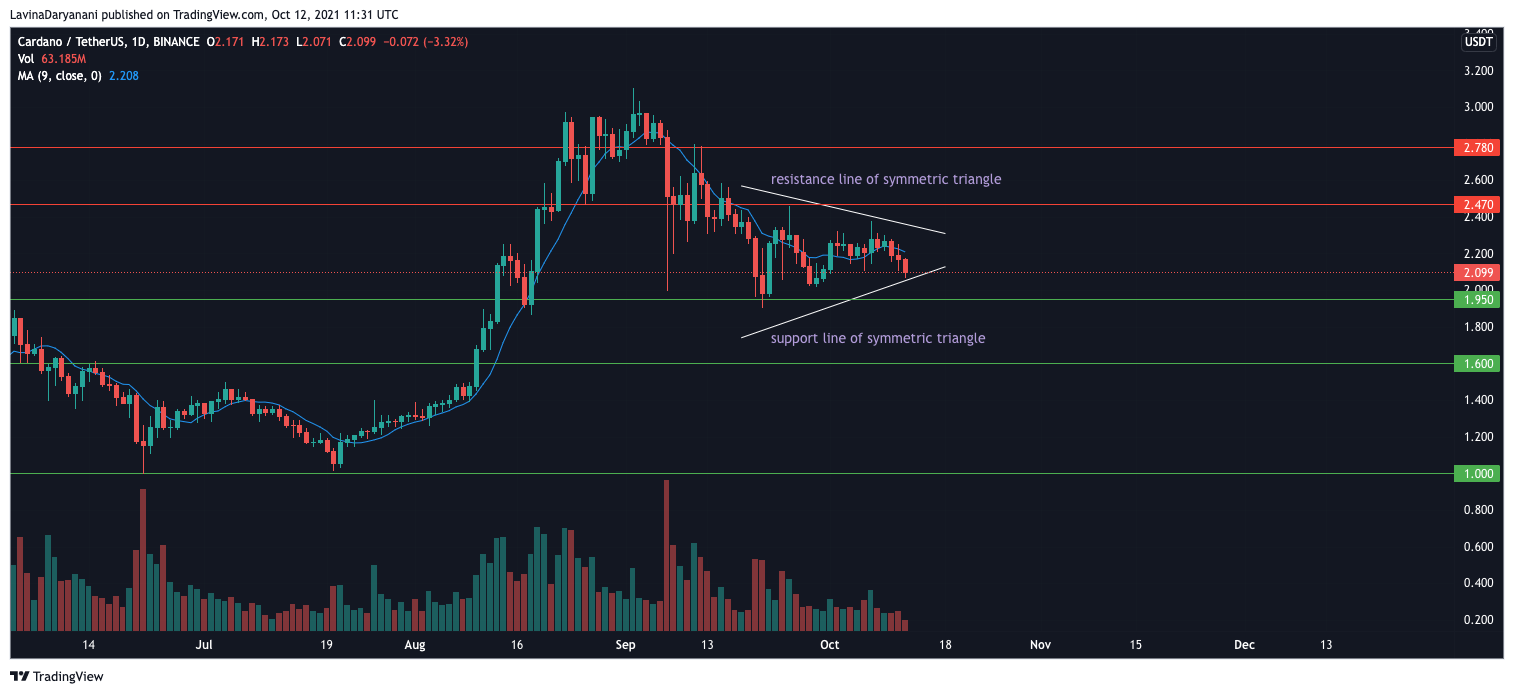
Additionally, ADA has been trading well below its moving average for over three days now, which isn’t a healthy sign. If bulls fail to re-enter the picture, then ADA’s price could fall to $1.95 and further to $1.60. Nevertheless, it should be noted that the $1-range has acted as a strong support level for Cardano since March this year.
Thus, the odds of ADA breaking below this level are quite minimal at the moment.
On the contrary, if the state of the aforementioned metrics starts improving, bulls manage to regain control and induce adequate buying pressure, one can expect ADA’s price to break above the upper resistance line of the triangle.
In such a situation, ADA’s price would be able to hit $2.47, before climbing to $2.80.