Cardano: With soaring on-chain transactions, here’s how far ADA can go

Disclaimer: The findings of the following analysis are the sole opinions of the writer and should not be considered investment advice
IntoTheBlock reported that the number of large transactions on the Cardano blockchain had increased by an enormous margin, which indicated that there was increasing institutional demand. Santiment also noted an uptick in the number of whales on the network. However, a little over half of the addresses on the network are out of the money, meaning they are holding ADA at a loss. What does this all mean for Cardano’s price in the weeks to come?
ADA- 1D
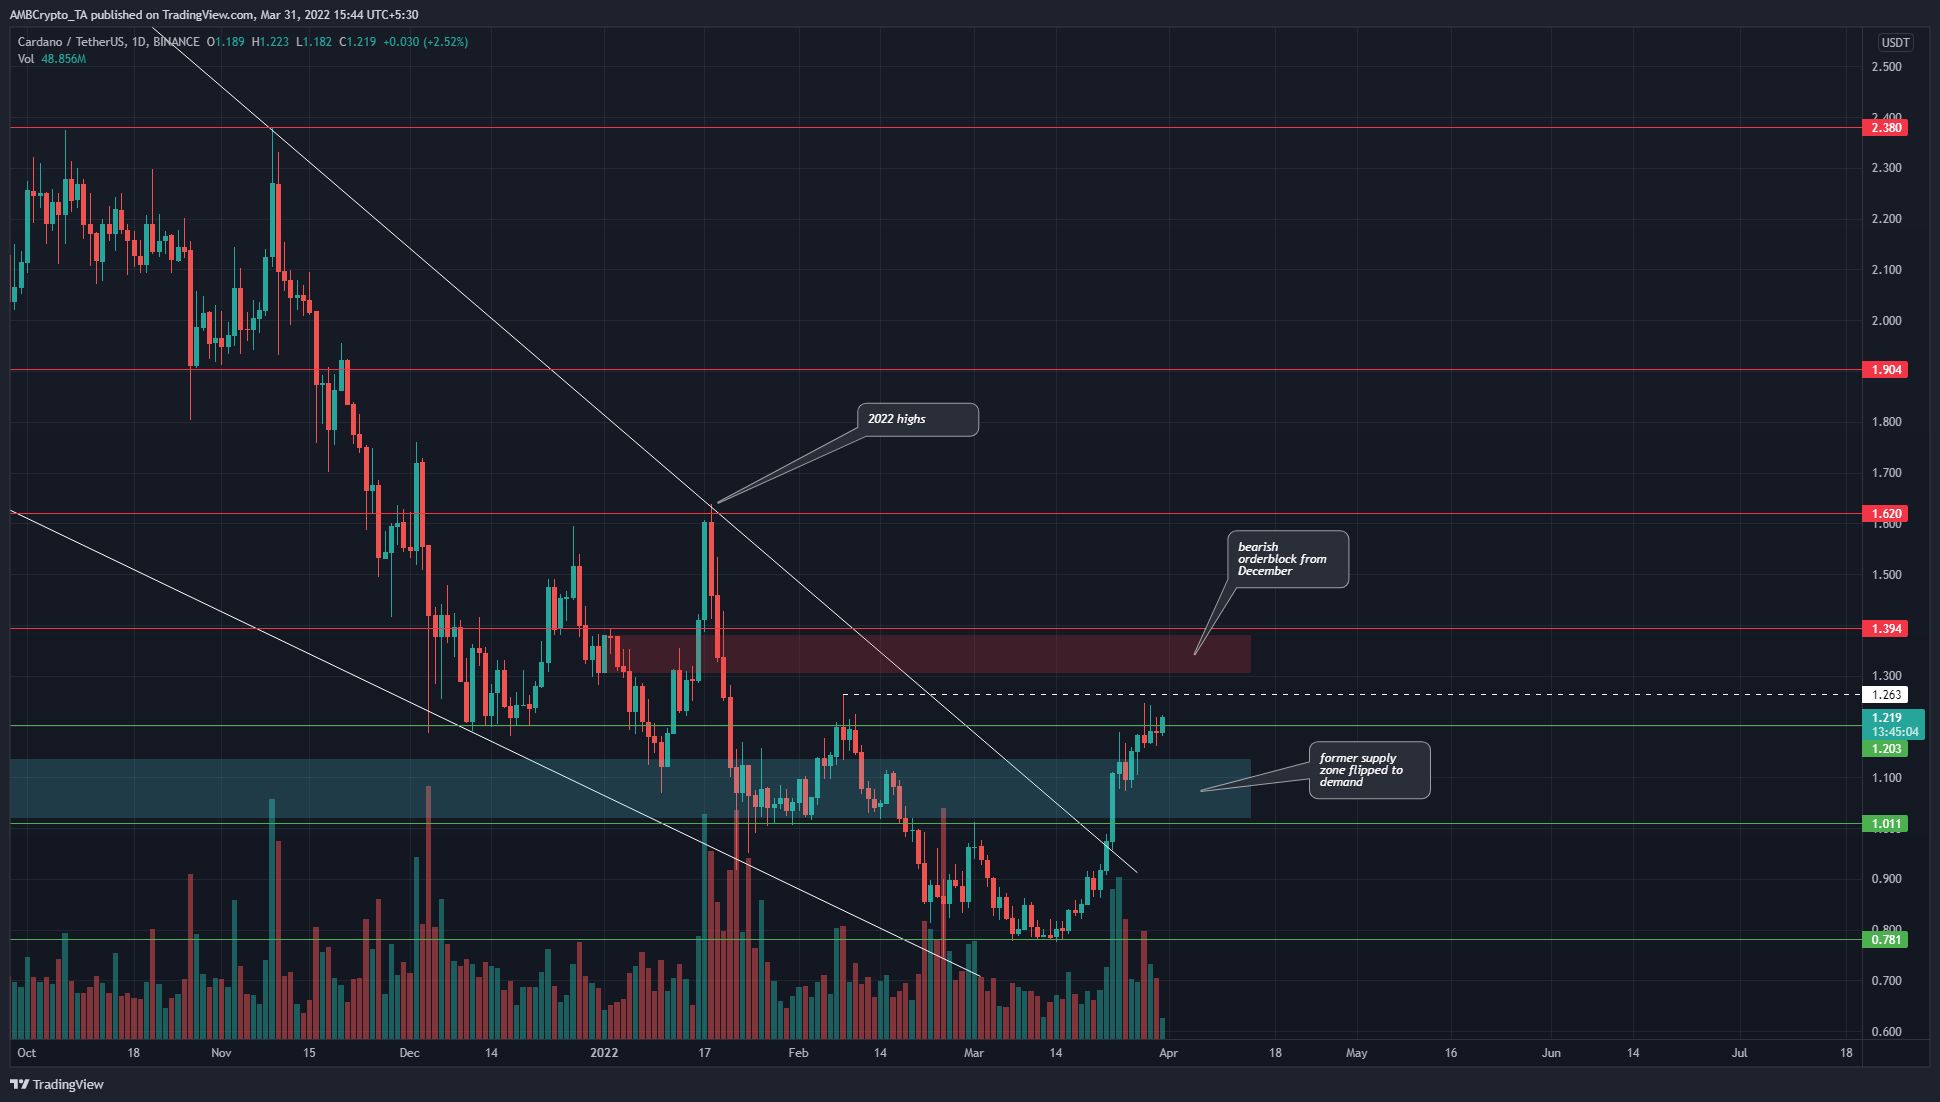
The longer-term market structure for ADA had been bearish as it went on a strong downtrend from September to early March. In the past few weeks, the price has broken out of a descending wedge pattern (white) and broken past the $1 level. The $1 level has been a strong area of resistance, both technically and psychologically in the past.
Yet, the bulls were able to push past this area, retest it to find some demand, and push toward $1.26. The next level of resistance lies at $1.39, with a bearish order block at $1.38 (red box) from late December.
Further north, the $1.6-$1.62 level would be the next area to look toward, should ADA succeed in pushing past $1.26 and $1.4.
Rationale
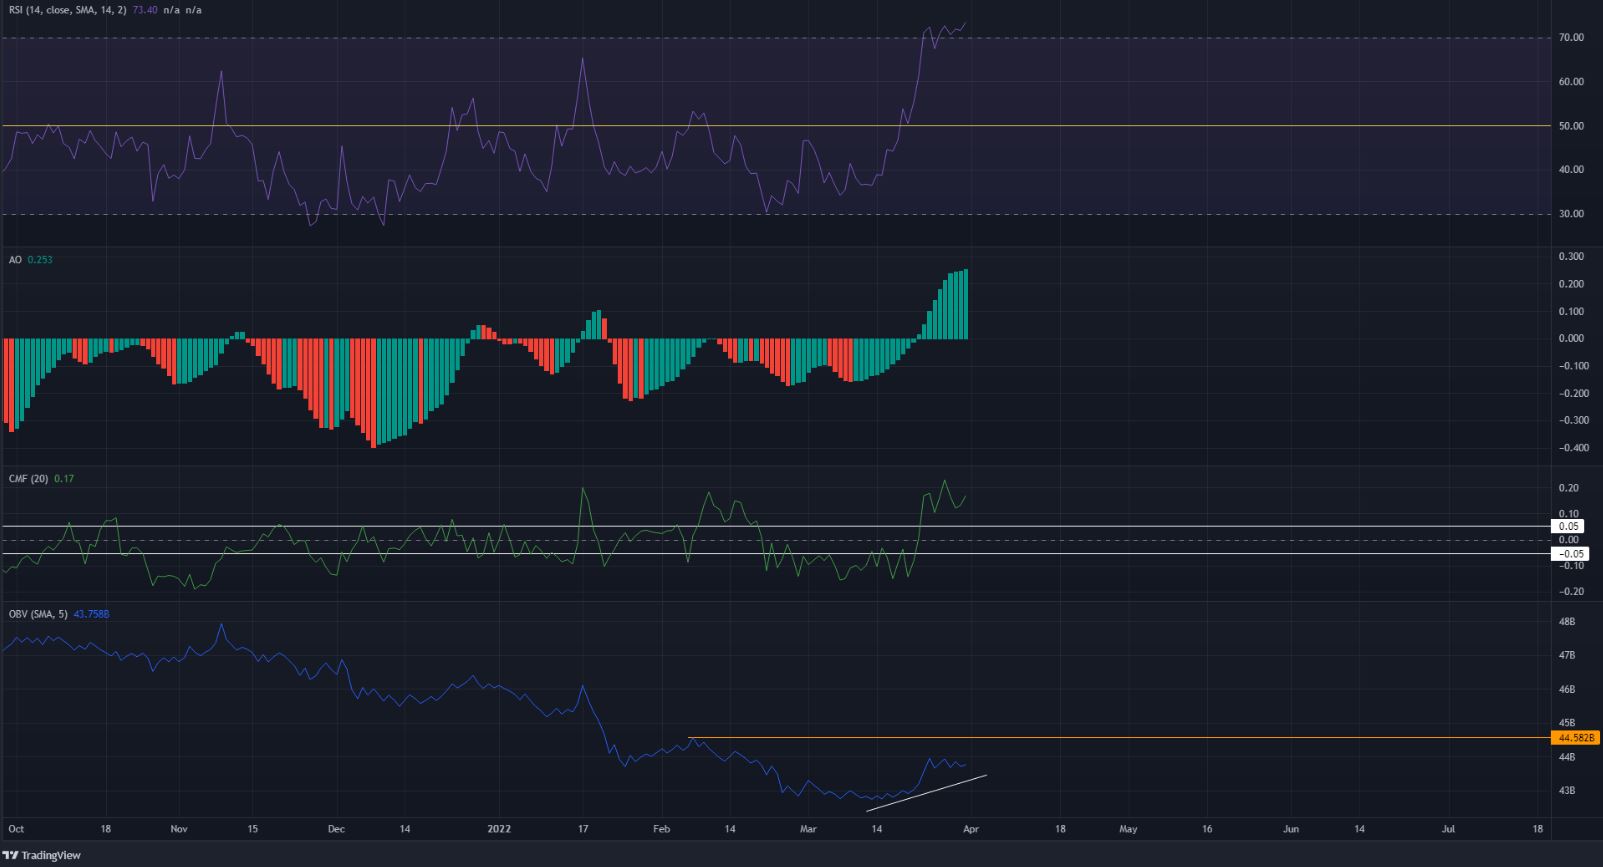
The indicators pointed to strong bullish momentum and good demand in the past couple of weeks. The RSI rose to 73 and no bearish divergence on higher timeframes was seen yet. The Awesome Oscillator also rose high above the zero line. Both of them showed strong bullish momentum.
The Chaikin Money Flow stood at 0.17, which was a sign of high demand in the past month. Alongside it, the OBV has also risen in the past couple of weeks. However, this was not enough to breach the orange level, which was the most recent lower high on the OBV.
Conclusion
The indicators showed there was a chance for further upside for Cardano. However, the $1.26-$1.4 area, and even slightly above that, could be a place where large market participants exit the markets just as retail enters on a wave of fresh enthusiasm. This could be the exit liquidity for a large move downward, and longer-term investors need to be wary of such possibilities.


