Chainlink, Aave, Cosmos Price Analysis: 22 February

LINK drifted close to the $30 support as sellers ramped up pressure over the last few sessions. Aave was projected to maintain its rangebound movement, barring a sharp pickup in its 24-hour trading volume. Lastly, Cosmos cooled off from its recent ATH and the bears could likely take control in the short term.
Chainlink [LINK]
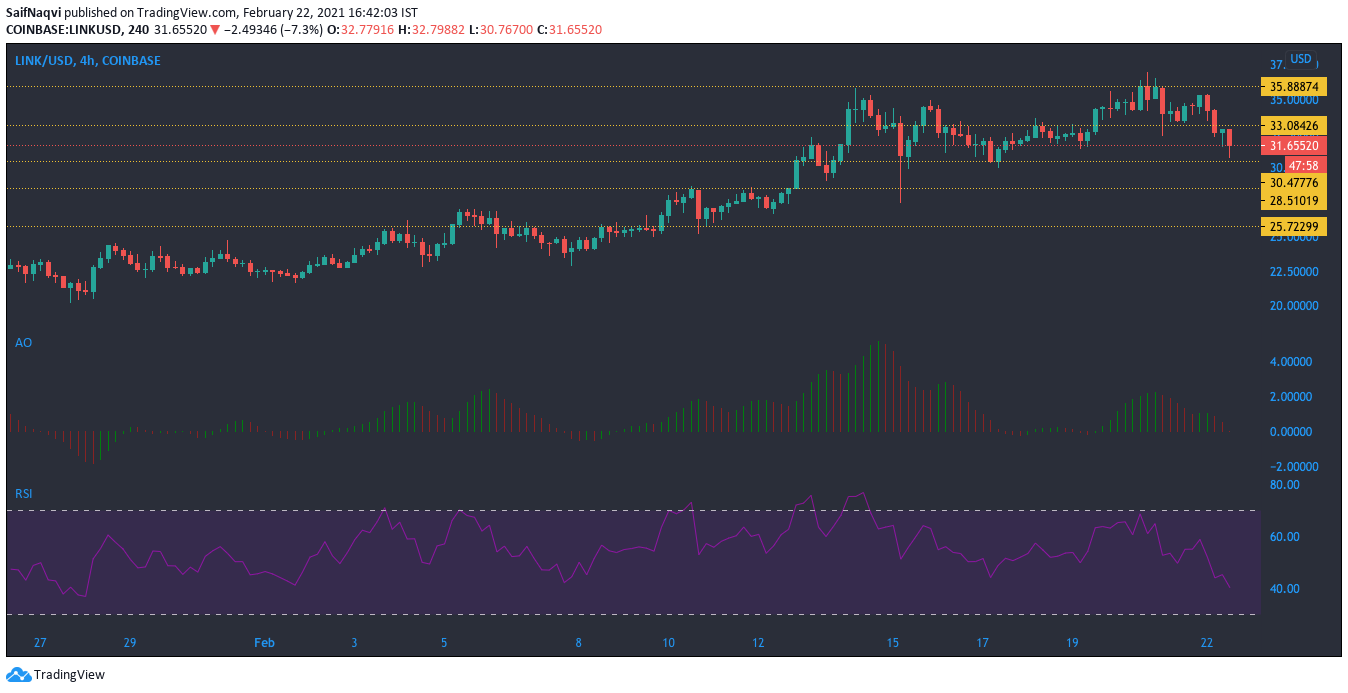
Losses in the last 24 hours amounted to nearly 10% as Chainlink moved closer to $30 support at the time of writing. Trading volume fell below the $2 billion mark while buying activity also took a dip. The RSI was yet to touch the oversold zone and an extended bearish outcome could see LINK trade close to $28.5 support.
The Awesome Oscillator’s red bars moved closer to the half-line as momentum rested with the sellers. A fall below equilibrium could present short signals for traders looking to make the most out of the bearish situation. If buying picks up at the current level, LINK could rise above its immediate upper ceiling and target record levels once again.
Aave [AAVE]

Source: AAVE/USD, TradingView
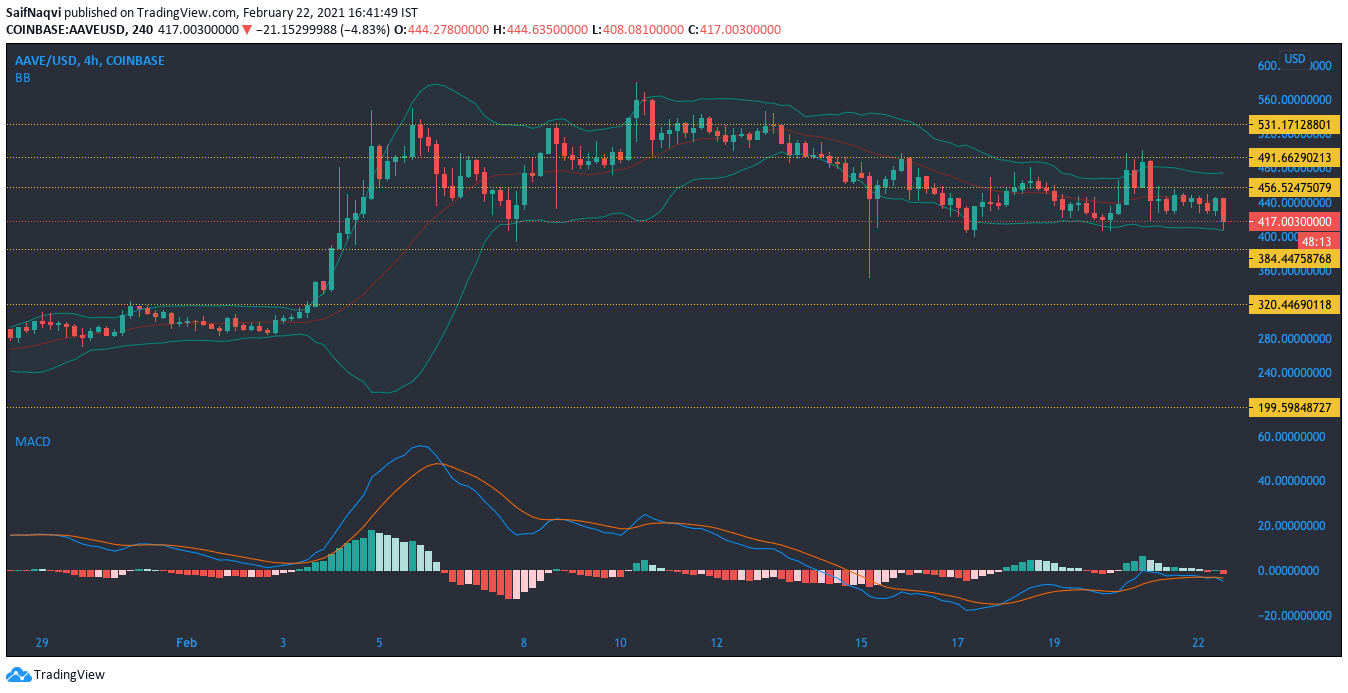
Aave’s uptrend has been solid as the cryptocurrency posted gains of over 100% in the last 30 days. During the month, AAVE also climbed to multiple record levels on the back of an apparent ‘DeFi season’.
However, the crypto asset entered a consolidation phase over the last few sessions as prices moved within a range. The Bollinger Bands were constricted as volatility remained on the lower side. The MACD line moved alongside the signal line as momentum remained weak on either side. A spike in the 24-hour trading volumes could signal a breakout and mark the end of the consolidation period.
Cosmos [ATOM]

Source: ATOM/USD, TradingView
Cosmos’ correction was clear on the daily charts, which showed a fall of over 13% since the cryptocurrency snapped its most recent all-time high at over $25. The RSI highlighted the reversal as the index moved southbound after trading in the overbought region for nearly 15 days.
A bearish crossover in the MACD suggested that the sell-off could continue over the next few trading sessions as well. In such a case, the next level of support resides at the $15 mark. In the event of a bullish bounce back, ATOM would first need to break above its immediate upper ceiling.


