Chainlink, Aave, FTX Token Price Analysis: 28 December

Chainlink surged past the $11.9-resistance level and knocked insistently on the $12.65-level’s doors. In fact, it could climb past it as well in the coming days. Aave was trading within a range, but had a bullish short-term outlook. FTX Token saw consistent buyers’ interest in the market and could move to $5.8 in the coming weeks.
Chainlink [LINK]
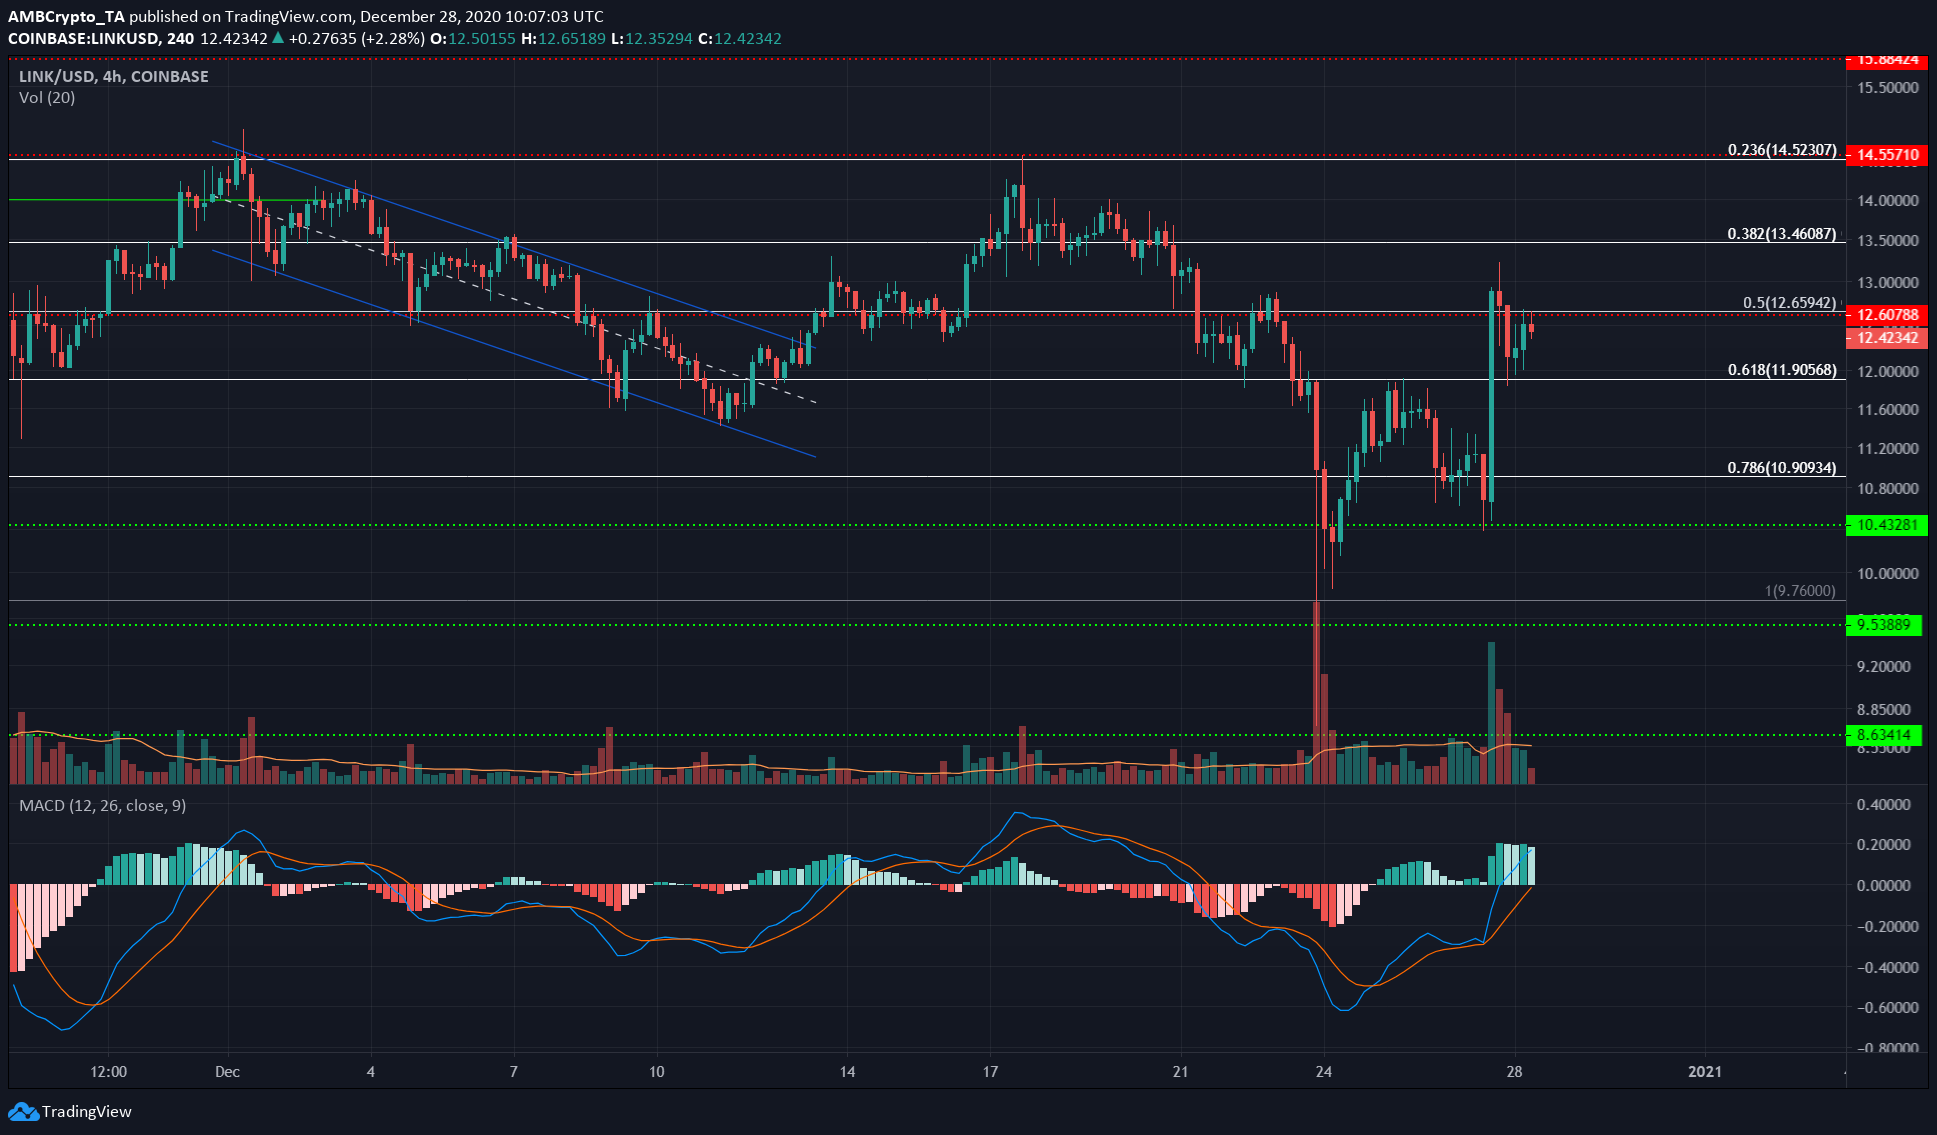
Chainlink shot upwards after a retest of the $10.4-support level and within a matter of hours, it tested the $12.65-level of resistance. It saw a pullback to the 61.8% retracement level at $11.9 and at the time of writing, was trading right under the resistance at $12.65 once more.
The MACD rose above zero and highlighted the bullish momentum behind LINK, while the trading volume was also considerable. This highlighted the likelihood that LINK would climb higher on the charts in the coming hours, with the $13.46-level as a short-term target.
Interestingly, a recent report noted that exchange inflows were increasing for LINK, something that could be bearish news for the digital asset.
Aave [AAVE]
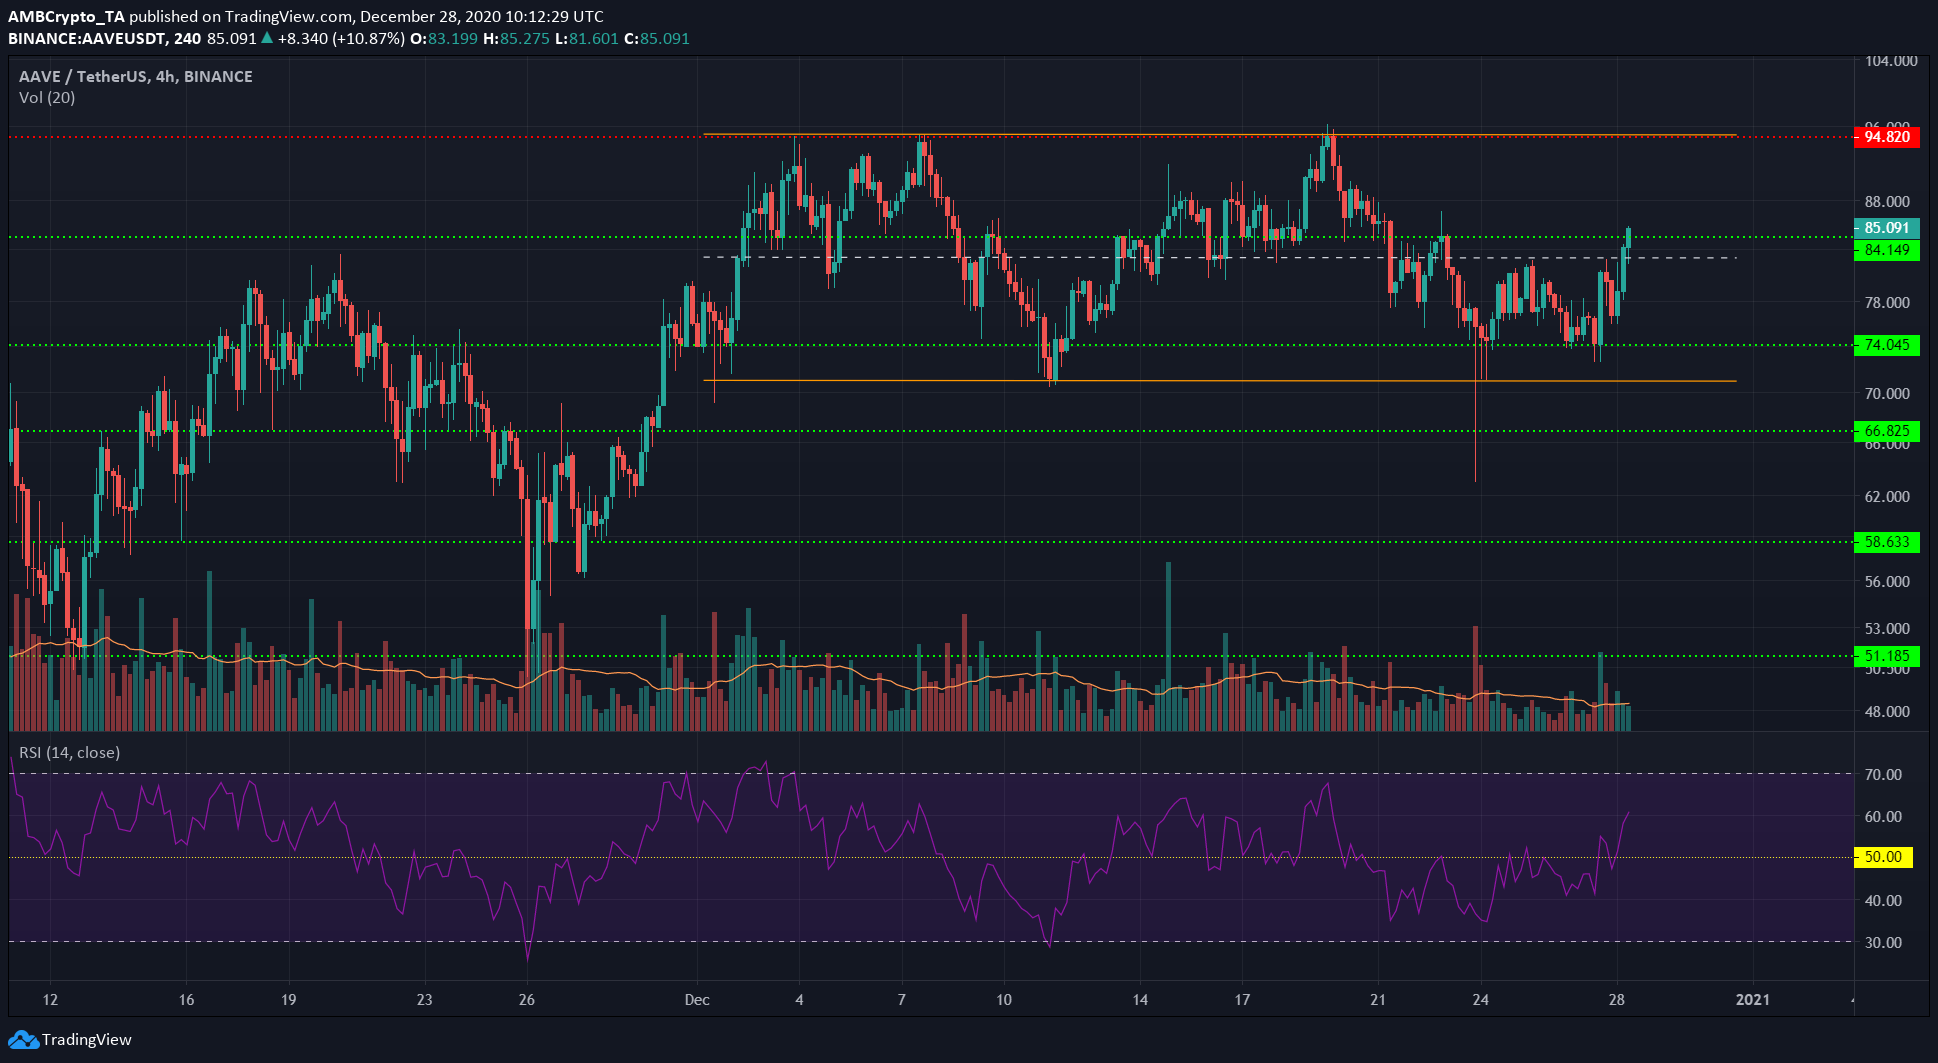
AAVE was trading within a range whose upper and lower boundaries lay at $94.8 and $70.9, respectively. The cryptocurrency’s price climbed past the mid-point of the range at $82.2 with momentum.
After a possible re-test of the $85-level to confirm its flip from resistance to support, it was likely to head towards the $94-resistance level. The RSI climbed above the neutral 50-zone and highlighted bullish momentum for AAVE amid a short-term uptrend.
FTX Token [FTT]
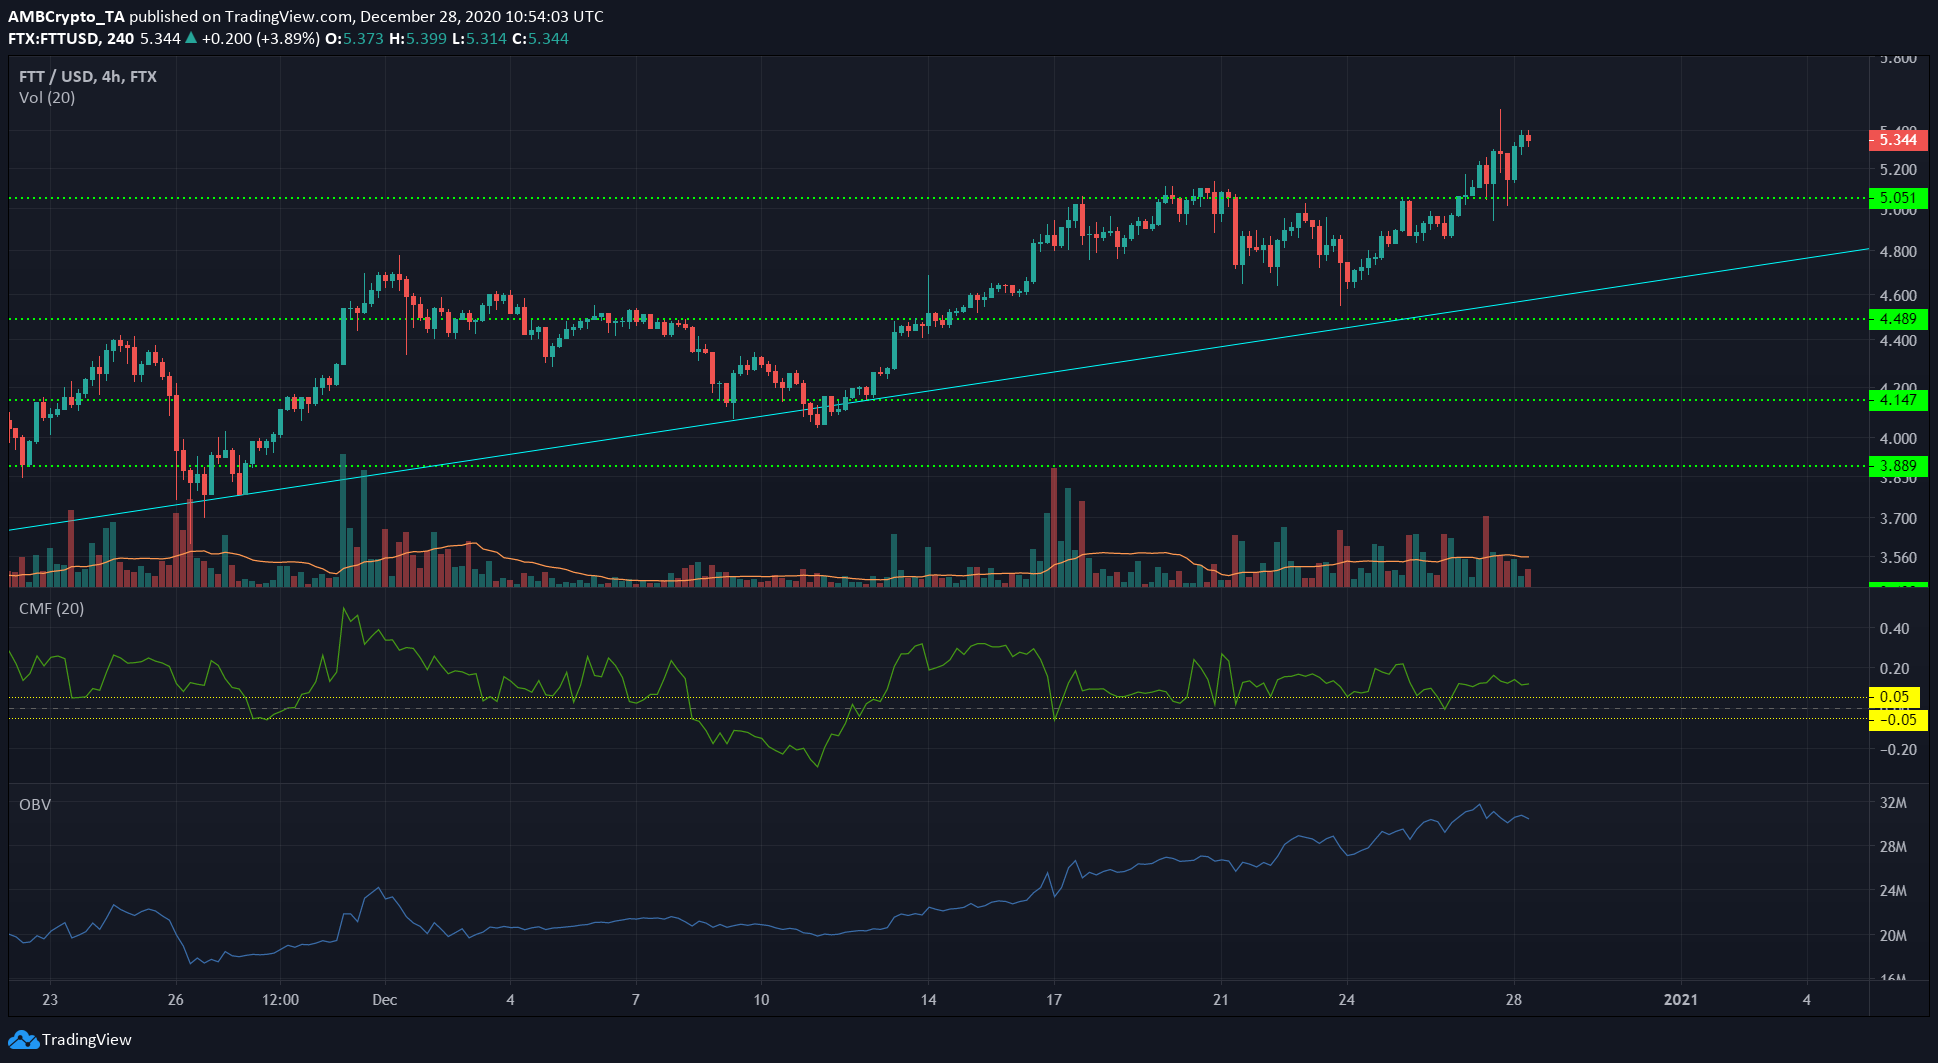
FTT’s indicators noted bullishness for FTT in the short-term. The Chaikin Money Flow was above +0.05 and denoted that capital inflows into the market outweighed outflows. The OBV was consistently rising to highlight buyer interest too, and any wave of selling pressure was being absorbed.
The cyan trendline captured FTT’s uptrend from early November when it was trading at $3.35. The trendline support was not under threat from the bears in the near-term, and the $5-level was recently flipped to support by the bulls.
The latest local high at $5.5 could soon be touched once more, and an ascent past $5.5 projected a rise to $5.8 for FTX Token.


