From a developmental point of view, this past week was a great week for the Chainlink Blockchain.
On 7 June, the Network published a roadmap and initial implementation of staking within the Chainlink network which “is to give ecosystem participants, including node operators and community members, the ability to increase the security guarantees and user assurances of oracle services by backing them with staked LINK tokens.”
Furthermore, during the course of the past week, the Network recorded 20 integrations of Chainlink services such as Chainlink External Adapter, Chainlink Price Feeds, and Chainlink VRF across five different chains.
As the rest of the cryptocurrency market struggles to ward off the bears, did Chainlink’s Native token, LINK, capitalize on these network developments to register some growth? Let’s take a look.
It’s a price decline…
Starting the week at an index price of $8.0, the LINK token registered an intra week growth of over 10% where it recorded a high of $9.45. However, a price correction occurred which led the bears to force a downward run. At press time, the LINK token exchanged hands at $5.84, registering a 27% over the course of seven days.
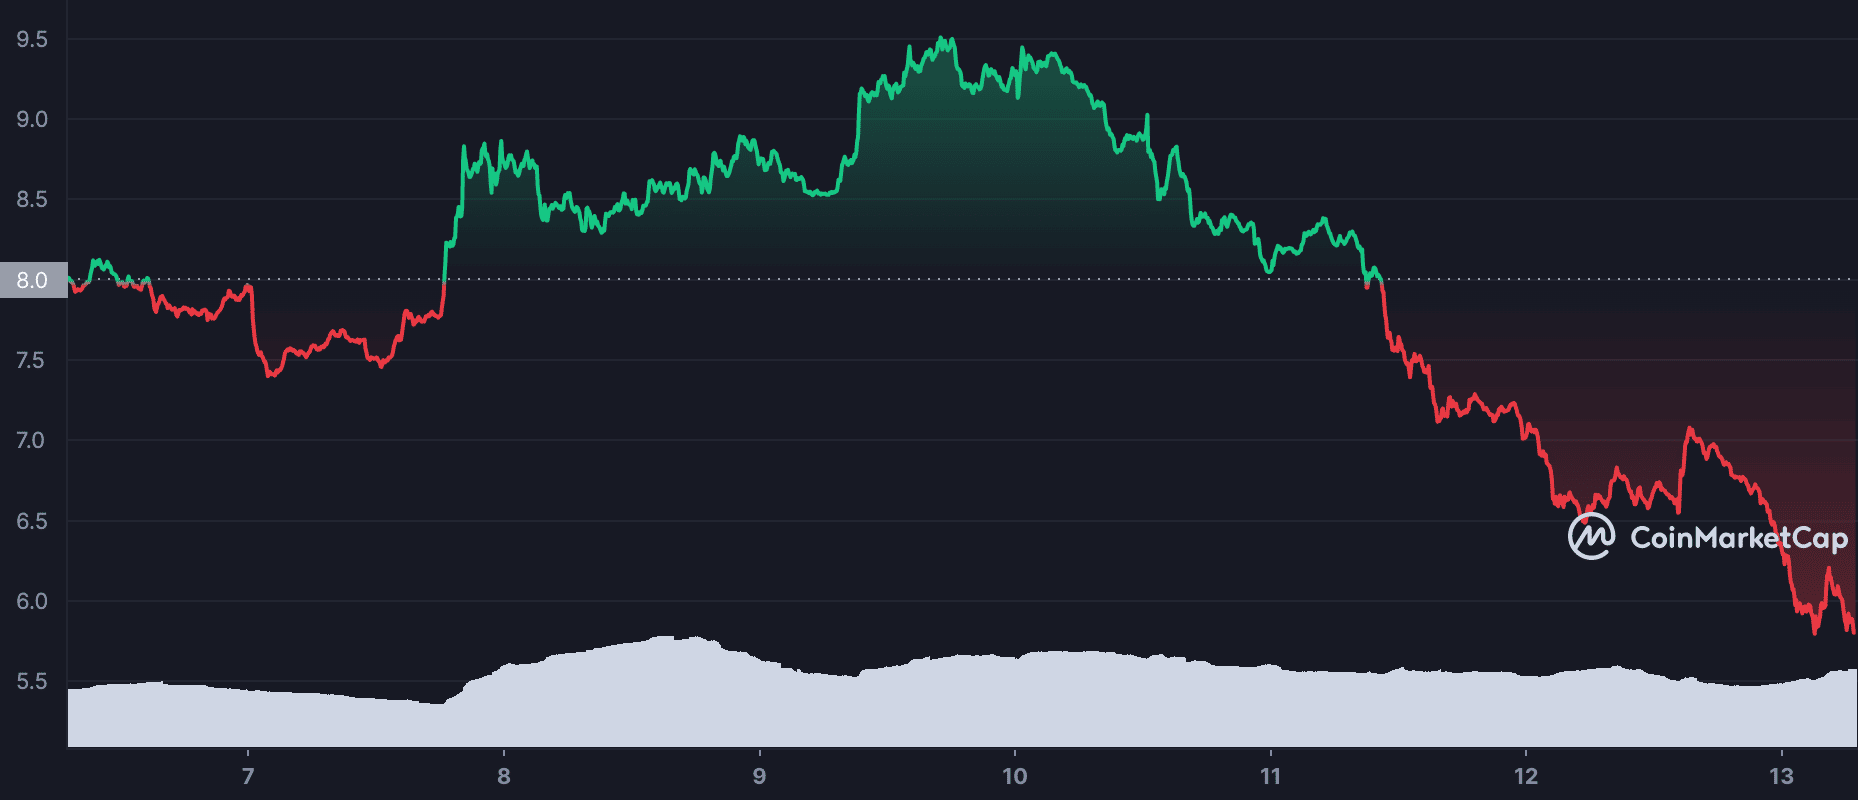
Source: CoinMarketCap
As a natural consequence of a drop in price, the market capitalization also registered a decline. Marking a high of $4.40 billion during the week, the market capitalization also witnessed a 26% drop within the past seven days.
As price went up on 9 June, the Relative Strength Index (RSI) rallied up and touched the 61 spot. However, the bears forced a correction that led this indicator on a downward trend since then. At press time, the RSI for the LINK token was stationed at 36.42, inching closer to the oversold region.
The Money Flow Index (MFI) also saw a high of 75 on 9 June. Standing at 57 at the time of writing, investors were spotted taking profits thus, forcing the MFI on a downward curve.
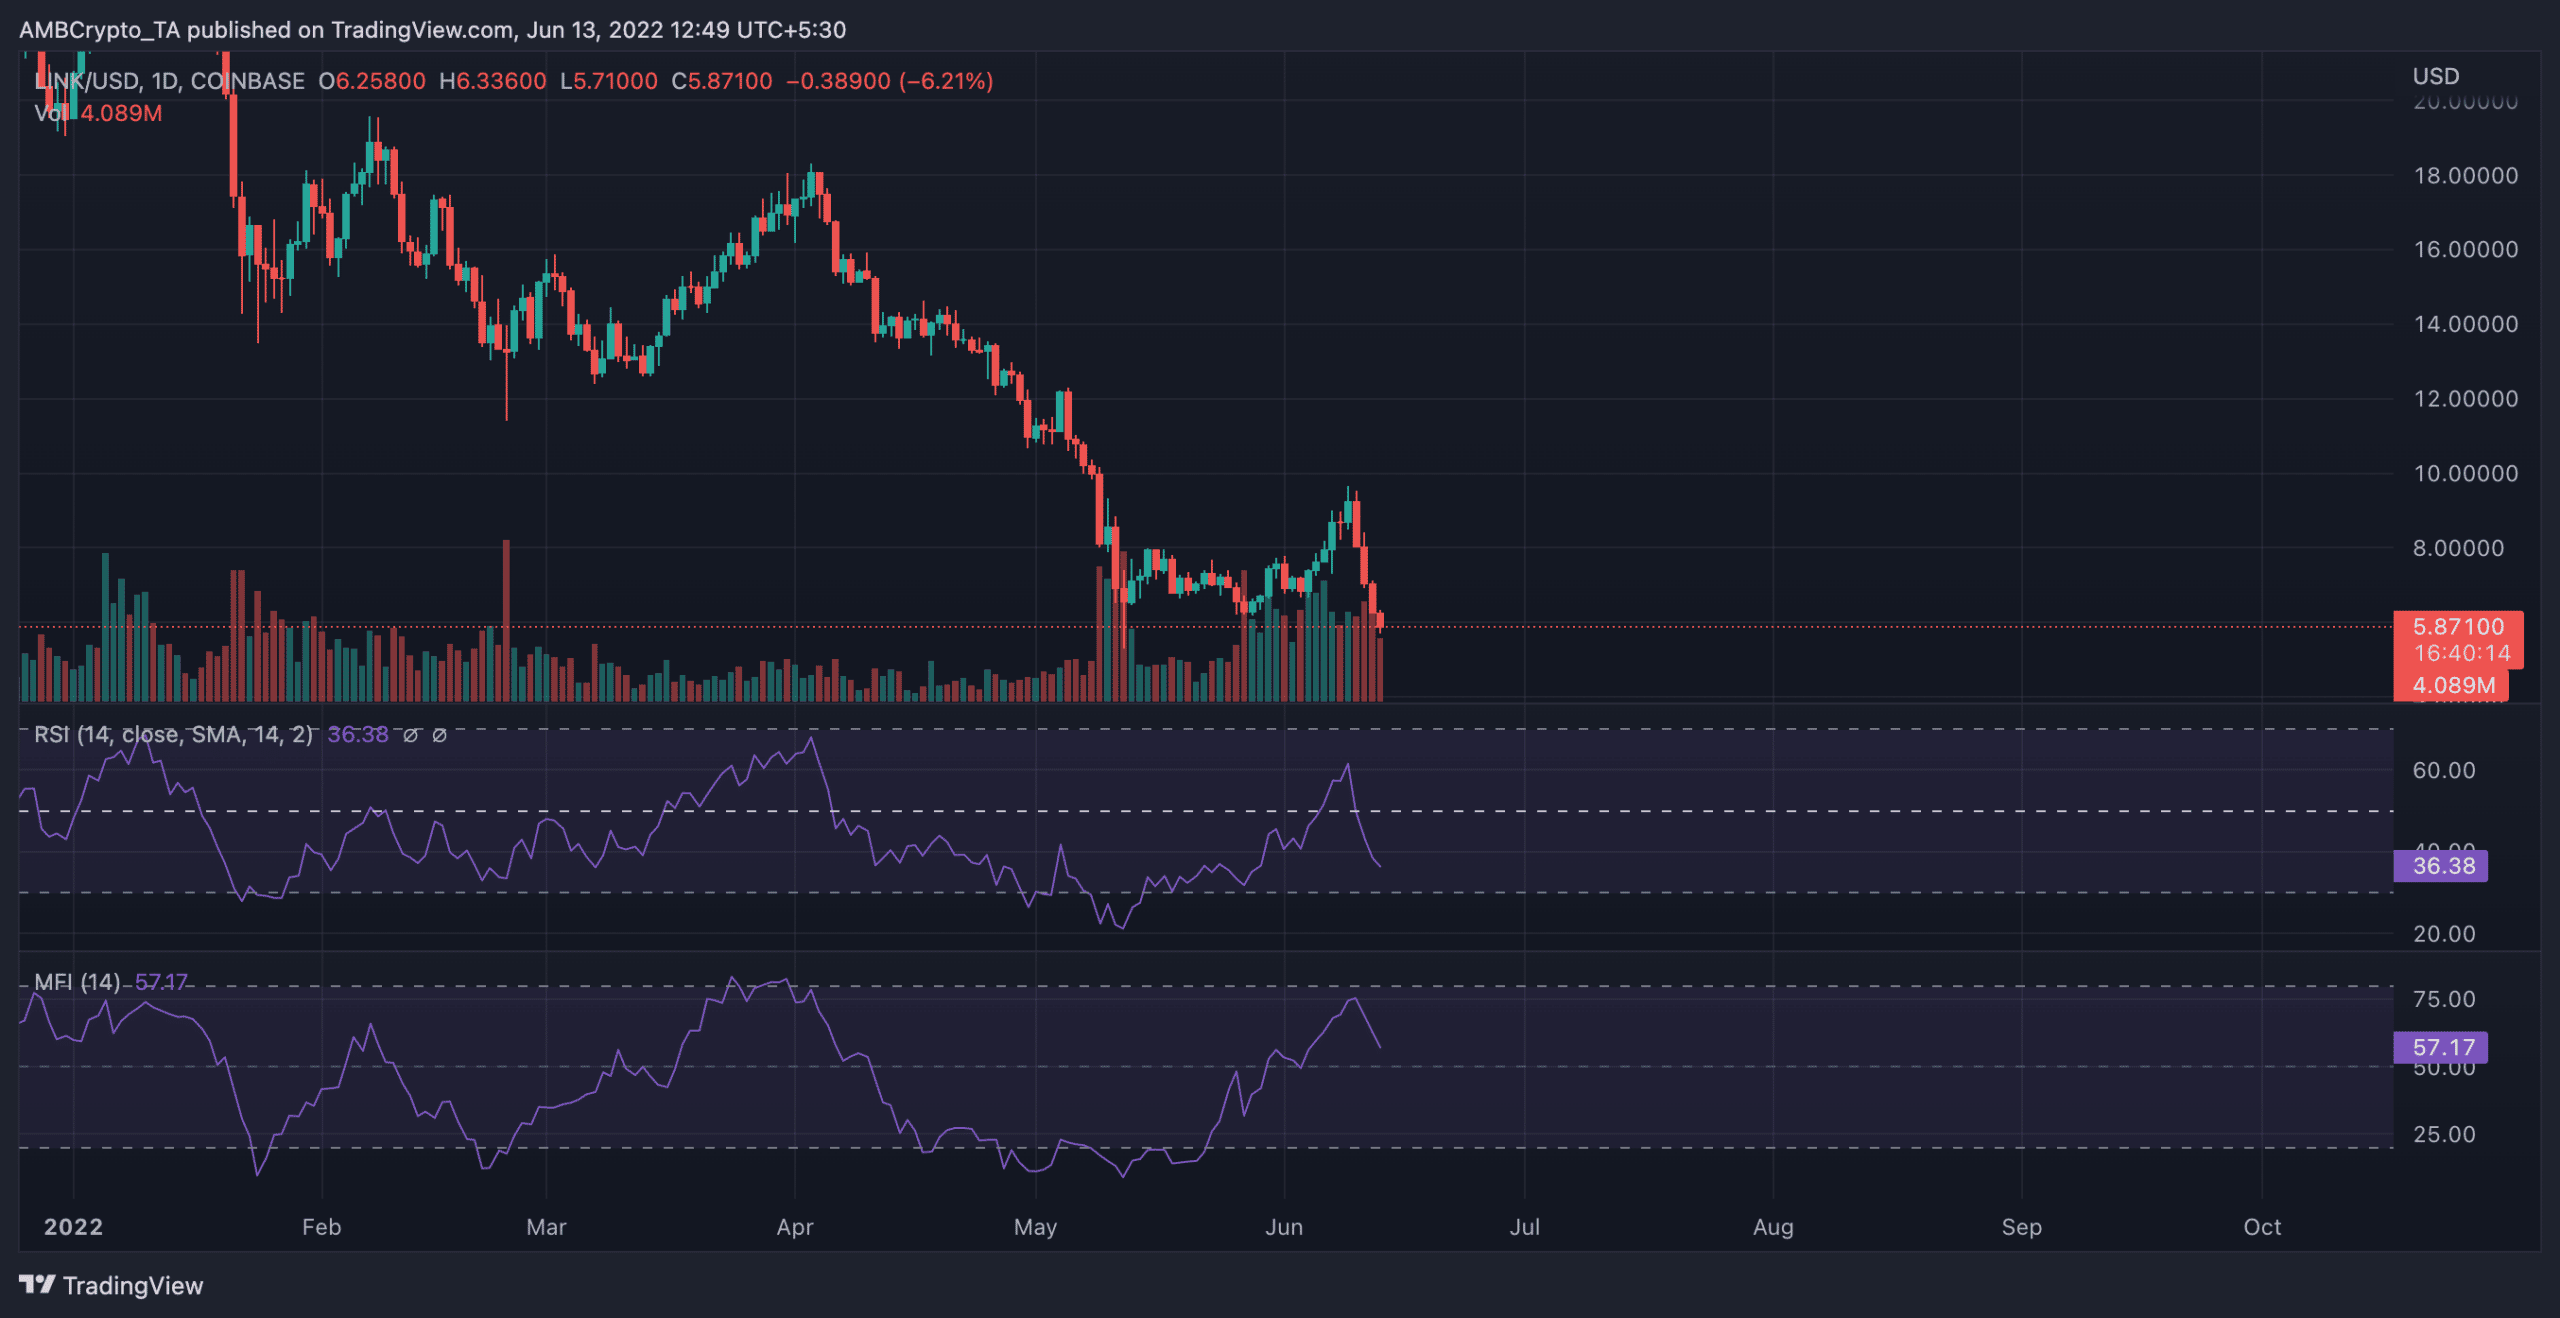
Source: TradingView
Up and down goes the…
On-chain analysis revealed that the LINK token swung high and low at different points across different metrics over the course of the last seven days. The number of active addresses that transacted the LINK token saw a drop on 10 June. By 11 June, this metric proceeded to register a 9% growth. At press time, this was pegged at 2,410, a 22% uptick from the 1,876 it lodged seven days ago.
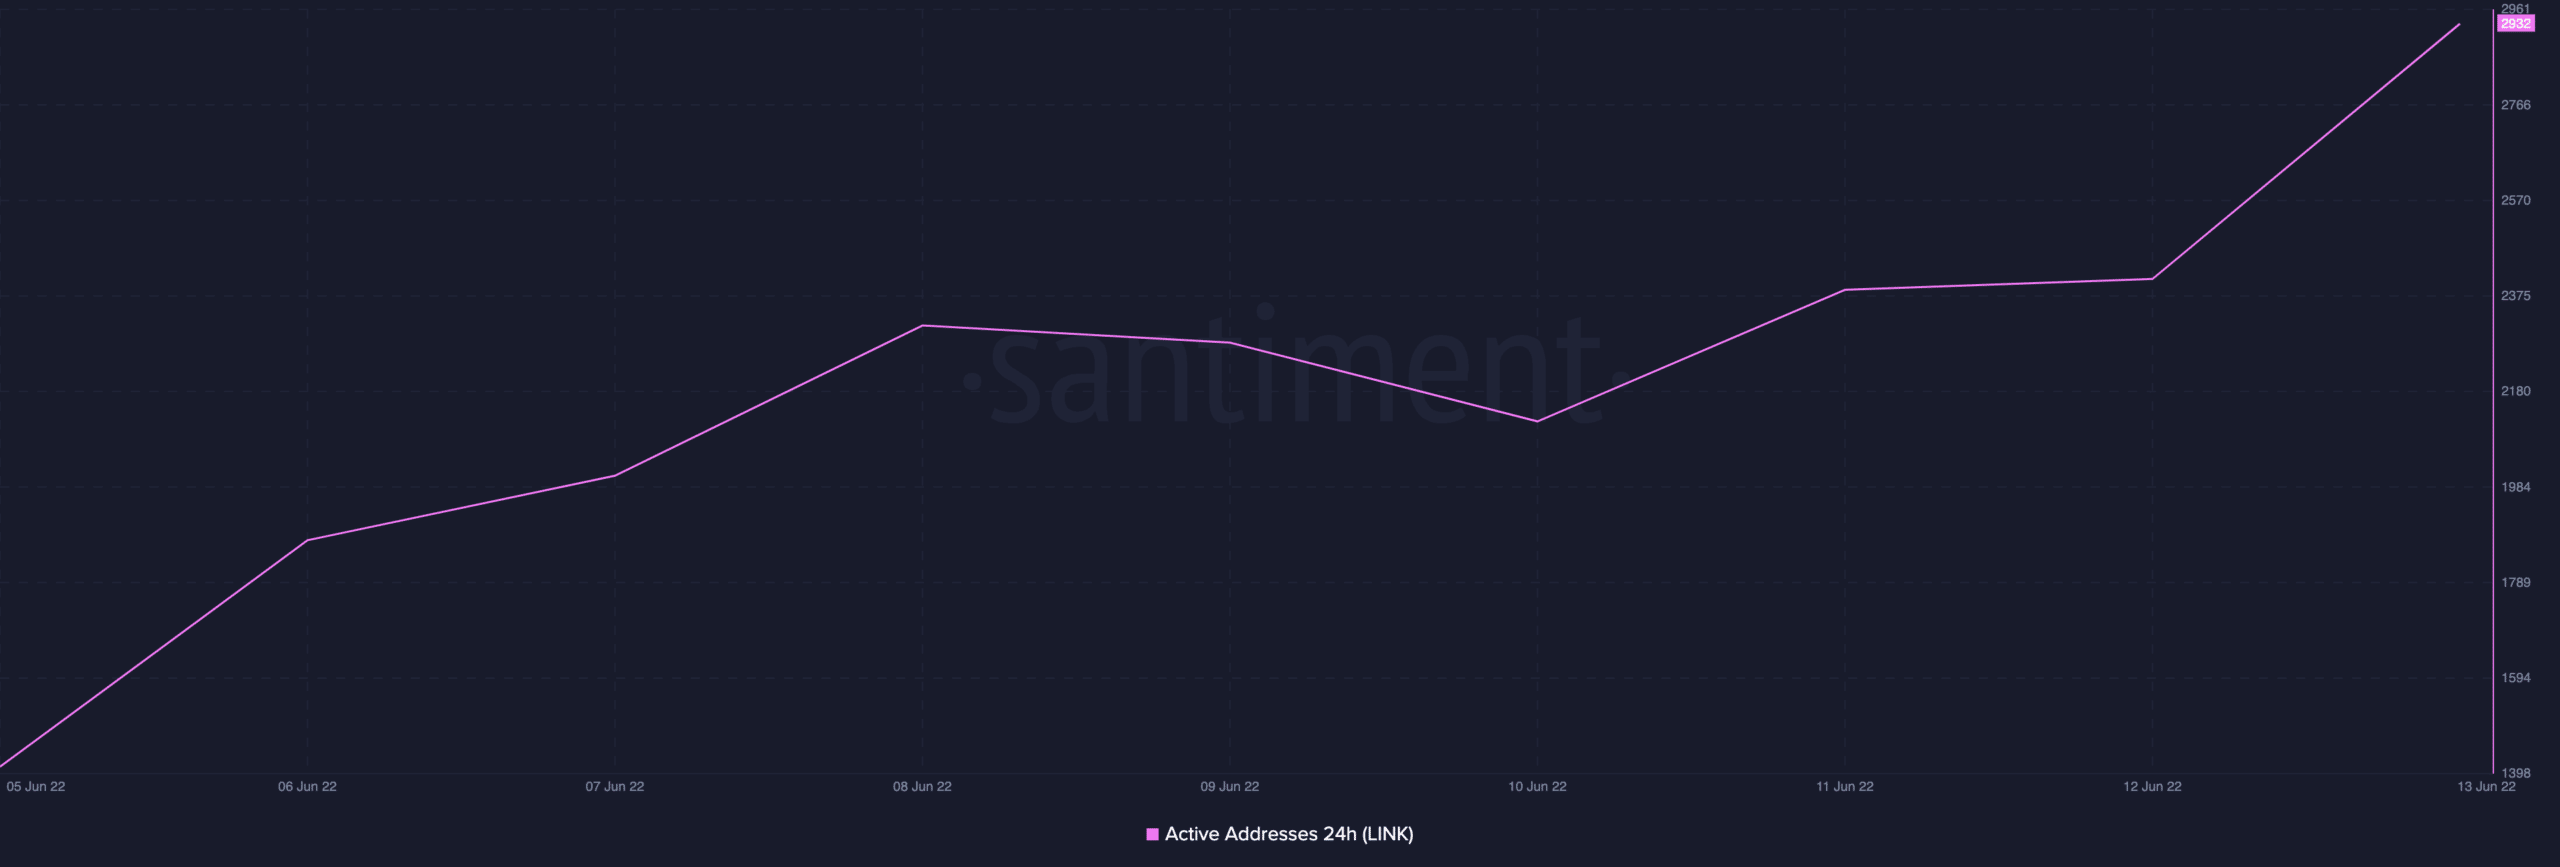
Source: Santiment
Furthermore, the token recorded saw spikes in whale transactions count on 8 June and 9 June. For transactions over $100k, the count went up by 29% on 8 June. This, however, proceeded on a steady decline to register a 45% drop by press time. Similarly, for transactions above $1 million, a 22% uptick was recorded on 9 June. By press time, this figure was down by 80%.
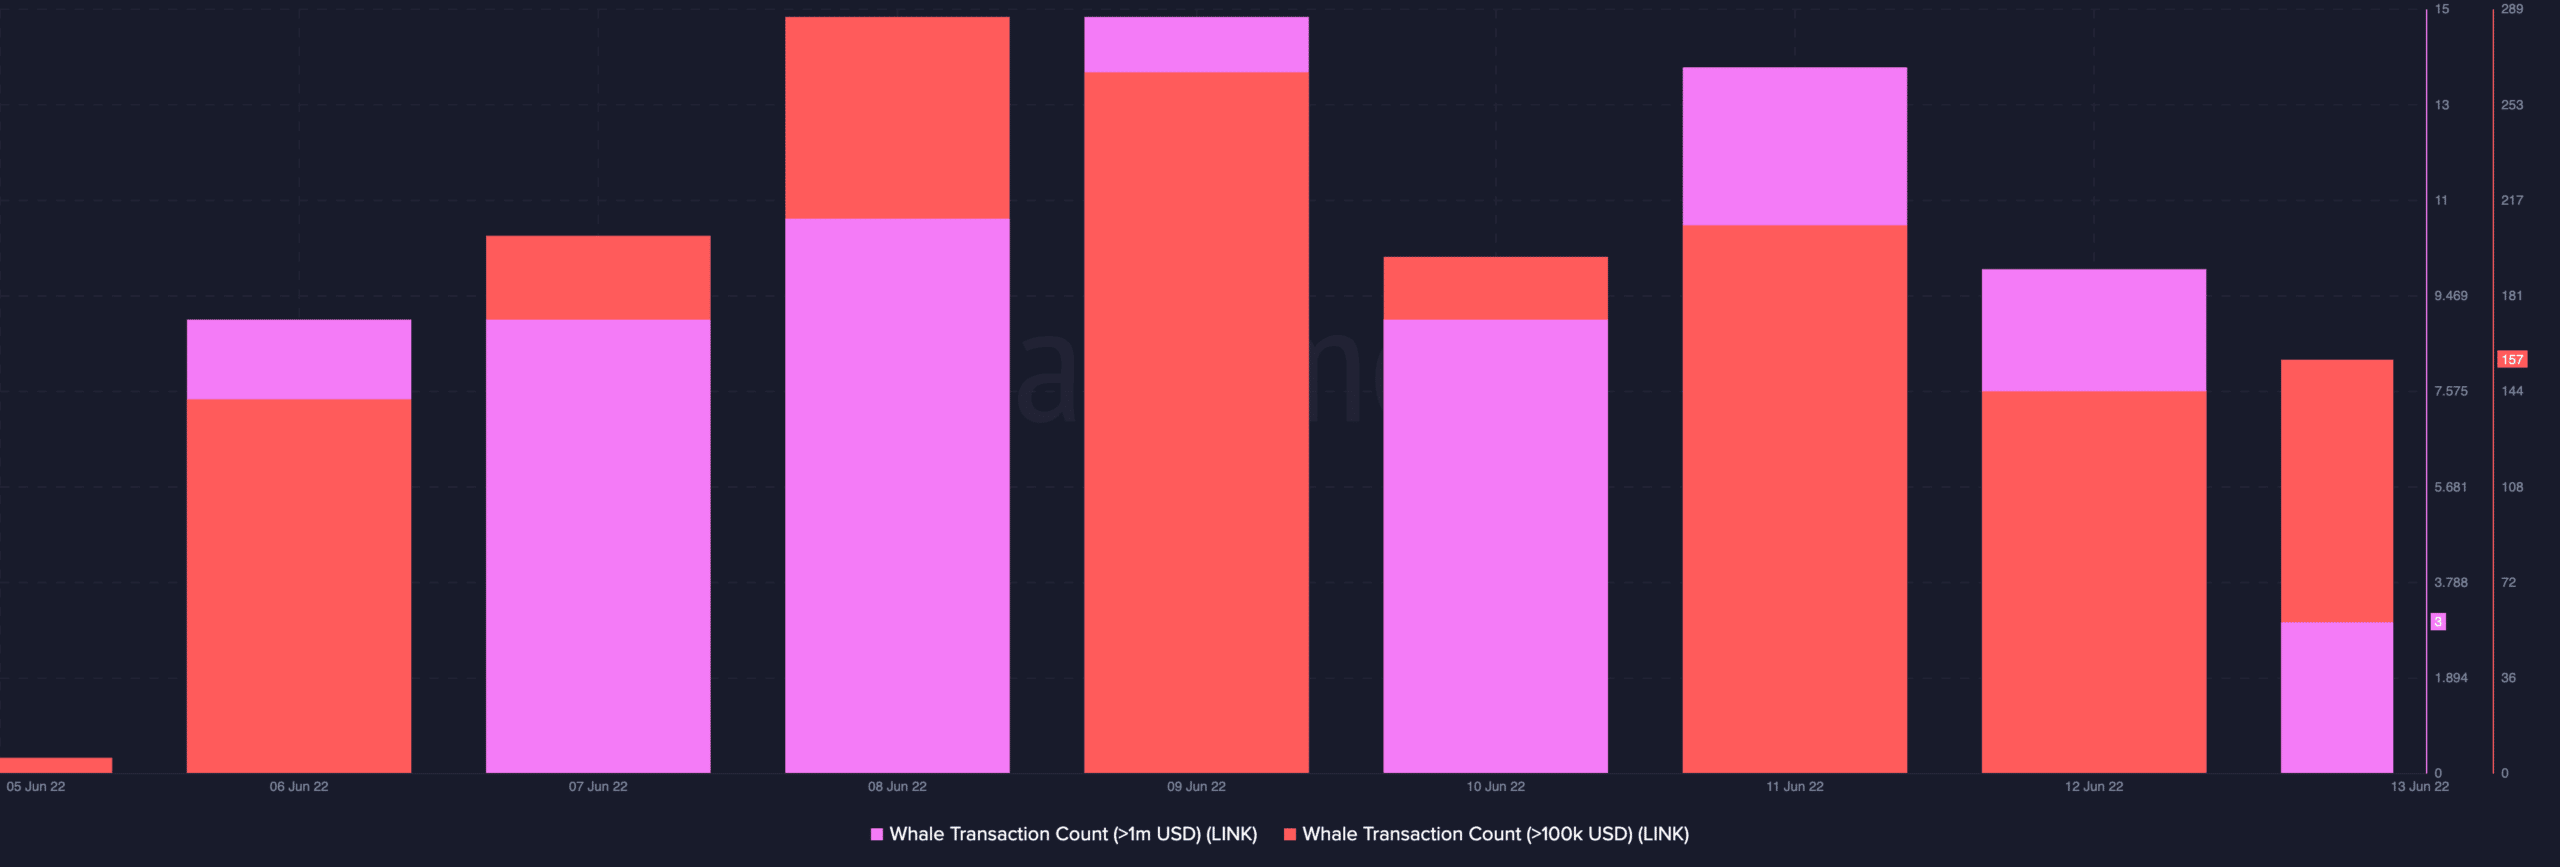
Source: Unsplash
Over the course of this past week, the bulls and bears appeared to have trailed one another closely as bullish and bearish sentiment registered 80% and 84% spikes respectively.

Source: LunarCrush