Chainlink, Fantom, MANA Price Analysis: 12 January

After poking its seven-week high on 11 January, Chainlink formed a bearish divergence with its 4-hour RSI.
Contrarily, Fantom saw a V-shaped recovery after flashing bullish near-term technicals. MANA also displayed a bullish bias after crossing its 20/50 SMA but could not back it up on increased volumes.
Chainlink (LINK)

Since the up-channel (yellow) breakdown on 3 December, LINK bulls retested the $22.42-level four times over the past month. They finally breached this level after the falling wedge (green) breakout resulted in two up-channels over the past 12 days.
LINK noted a 50.2% ROI (from 1 January low) until it poked its seven-week high on 11 January. The alt flipped the $25.7 support from resistance (for nearly 40 days).
The volume Oscillator marked lower peaks, indicating a weak bullish rally over the past few days.
At press time, LINK traded 49.3% below its ATH at $26.48. The price saw exponential gains while the RSI marked lower peaks, revealing a bearish divergence. Further, the AO chose the buyers but saw lower highs, reaffirming their decreasing strength.
Fantom (FTM)

After forming a bearish divergence (white), FTM price action reversed from its supply zone (rectangle, yellow).
The ascending broadening wedge (white) saw a break down after FTM poked its two-month high on 5 January. Since then, the alt lost nearly 34.1% of its value to find testing grounds at the $2.09-mark. From here, it regained more than the value it lost after in a V-shaped recovery (yellow). The alt gained 34.2% from the 10 January low until press time.
At press time, FTM traded at $2.8461. The RSI steeply surged and looked turned its back on the overbought territory. Further, the DMI flashed a bullish bias too. However, the OBV corresponded with the spike, hinting at an increased buying pressure.
Decentraland (MANA)
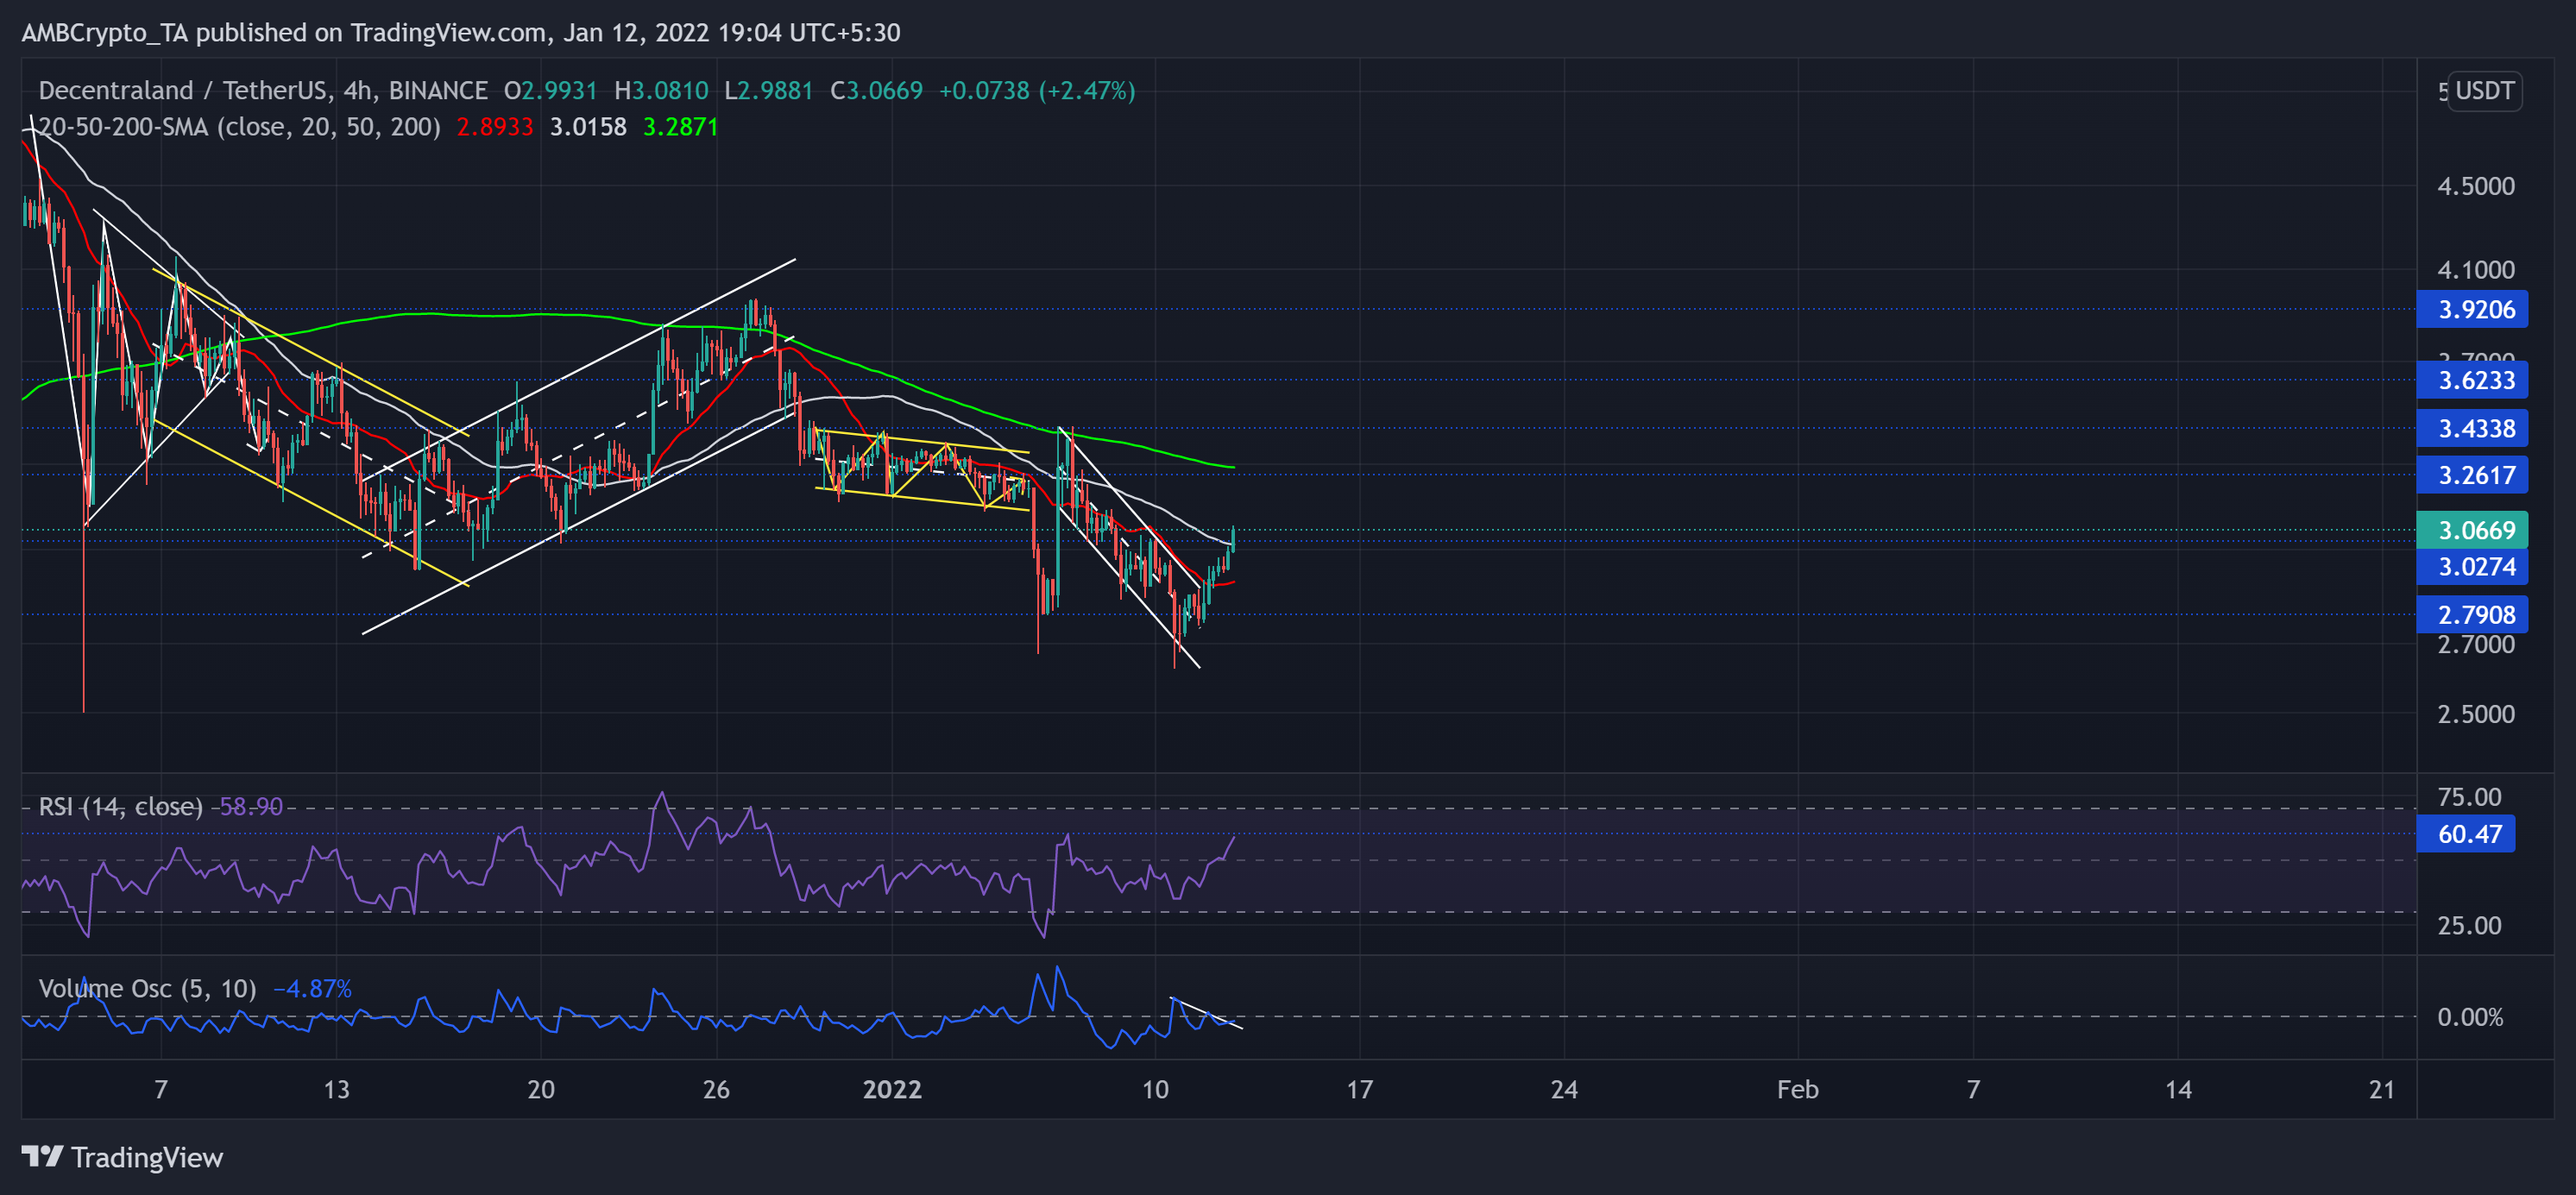
On its 4-hour chart, the alt saw a breakdown from the down-channel (yellow) until the $2.7-mark two-month support. The token saw a 22% incline on 6 January after Samsung stepped into its metaverse.
However, it succumbed to the broader sell-off by over-retracing the previous jump in a down-channel (white). Accordingly, MANA poked its five-week low on 10 January.
Now, with over 17% gains over the past two days, MANA reclaimed the $3.02 support.
At press time, MANA traded above its 20/50 SMA at $3.0669. The RSI crossed the half-line to test the 60-mark and flashed a bullish bias. Further, the Volume Oscillator marked lower peaks, hinting at a weak bullish move.