Chainlink: How to take advantage of LINK as it approaches the crucial $6.3 zone

Disclaimer: The information presented does not constitute financial, investment, trading, or other types of advice and is solely the opinion of the writer.
Chainlink has formed a range between the $7.83 and $6.29 levels (yellow) over the past three weeks. The mid-point of the range lies at $7.06, and it has acted as support and resistance for LINK when trading within the range.
Moreover, there is also a horizontal support level at $6.66 which the price has respected. The past few hours of trading showed LINK to drop sharply beneath the mid-range point at $7.06 and retest it as resistance.
Therefore, the range can offer buyers an opportunity to enter a trade if LINK reaches the range lows and begins to reverse.
LINK- 4 Hour Chart
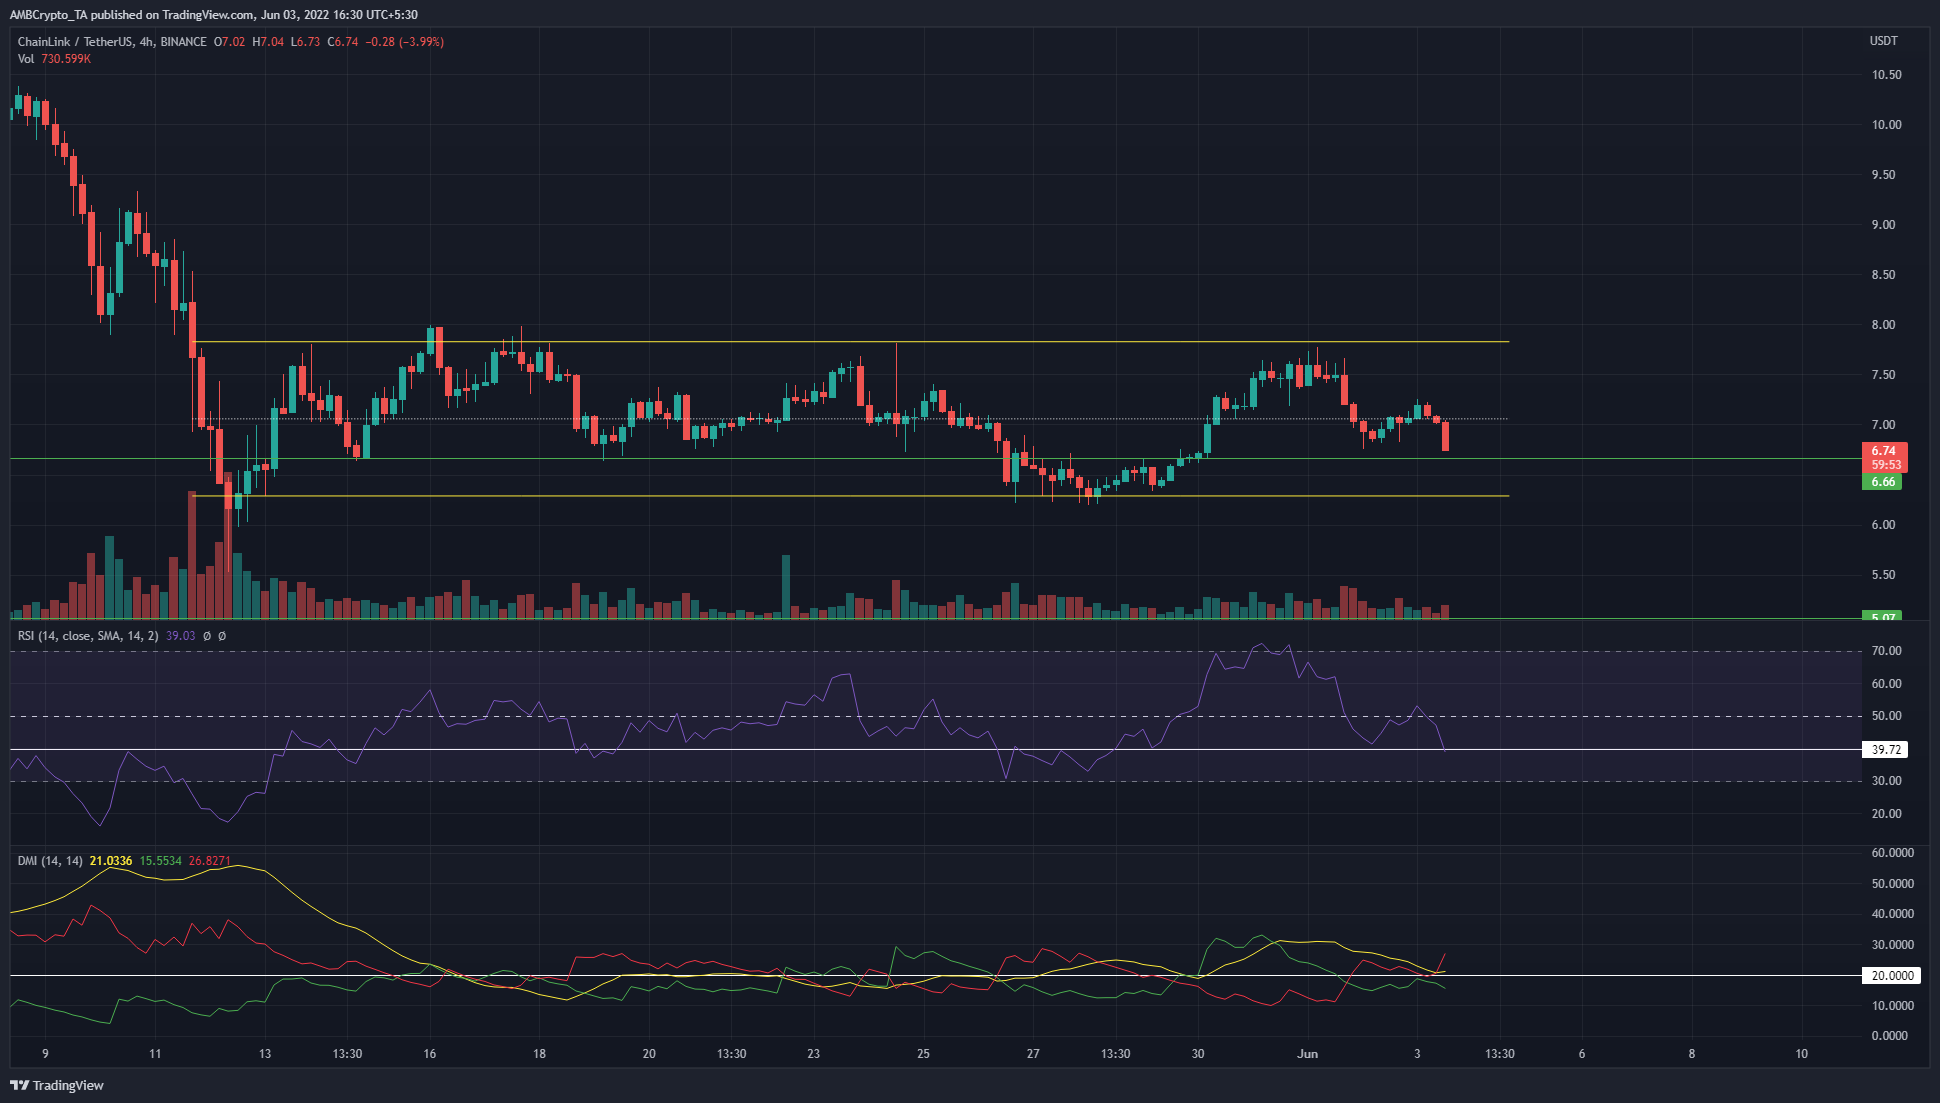
In the past three weeks, the RSI has not remained above or below the neutral 50 line, which showed the lack of a strong trend behind LINK. The Directional Movement Index also showed a clear lack of trend, as the +DI, the -DI, and the ADX line have all hovered quite close to the 20 mark.
Another point of interest was how the 39-40 area has been important on the H4 RSI. If it drops below this mark, it would be a signal of strong bearish momentum and could presage a drop to the range lows at $6.3. At the same time, the last time LINK retested the range lows on 25 May, the RSI formed a bullish divergence. This could repeat on lower timeframes to offer an entry to a long position.
LINK- 1 Hour Chart
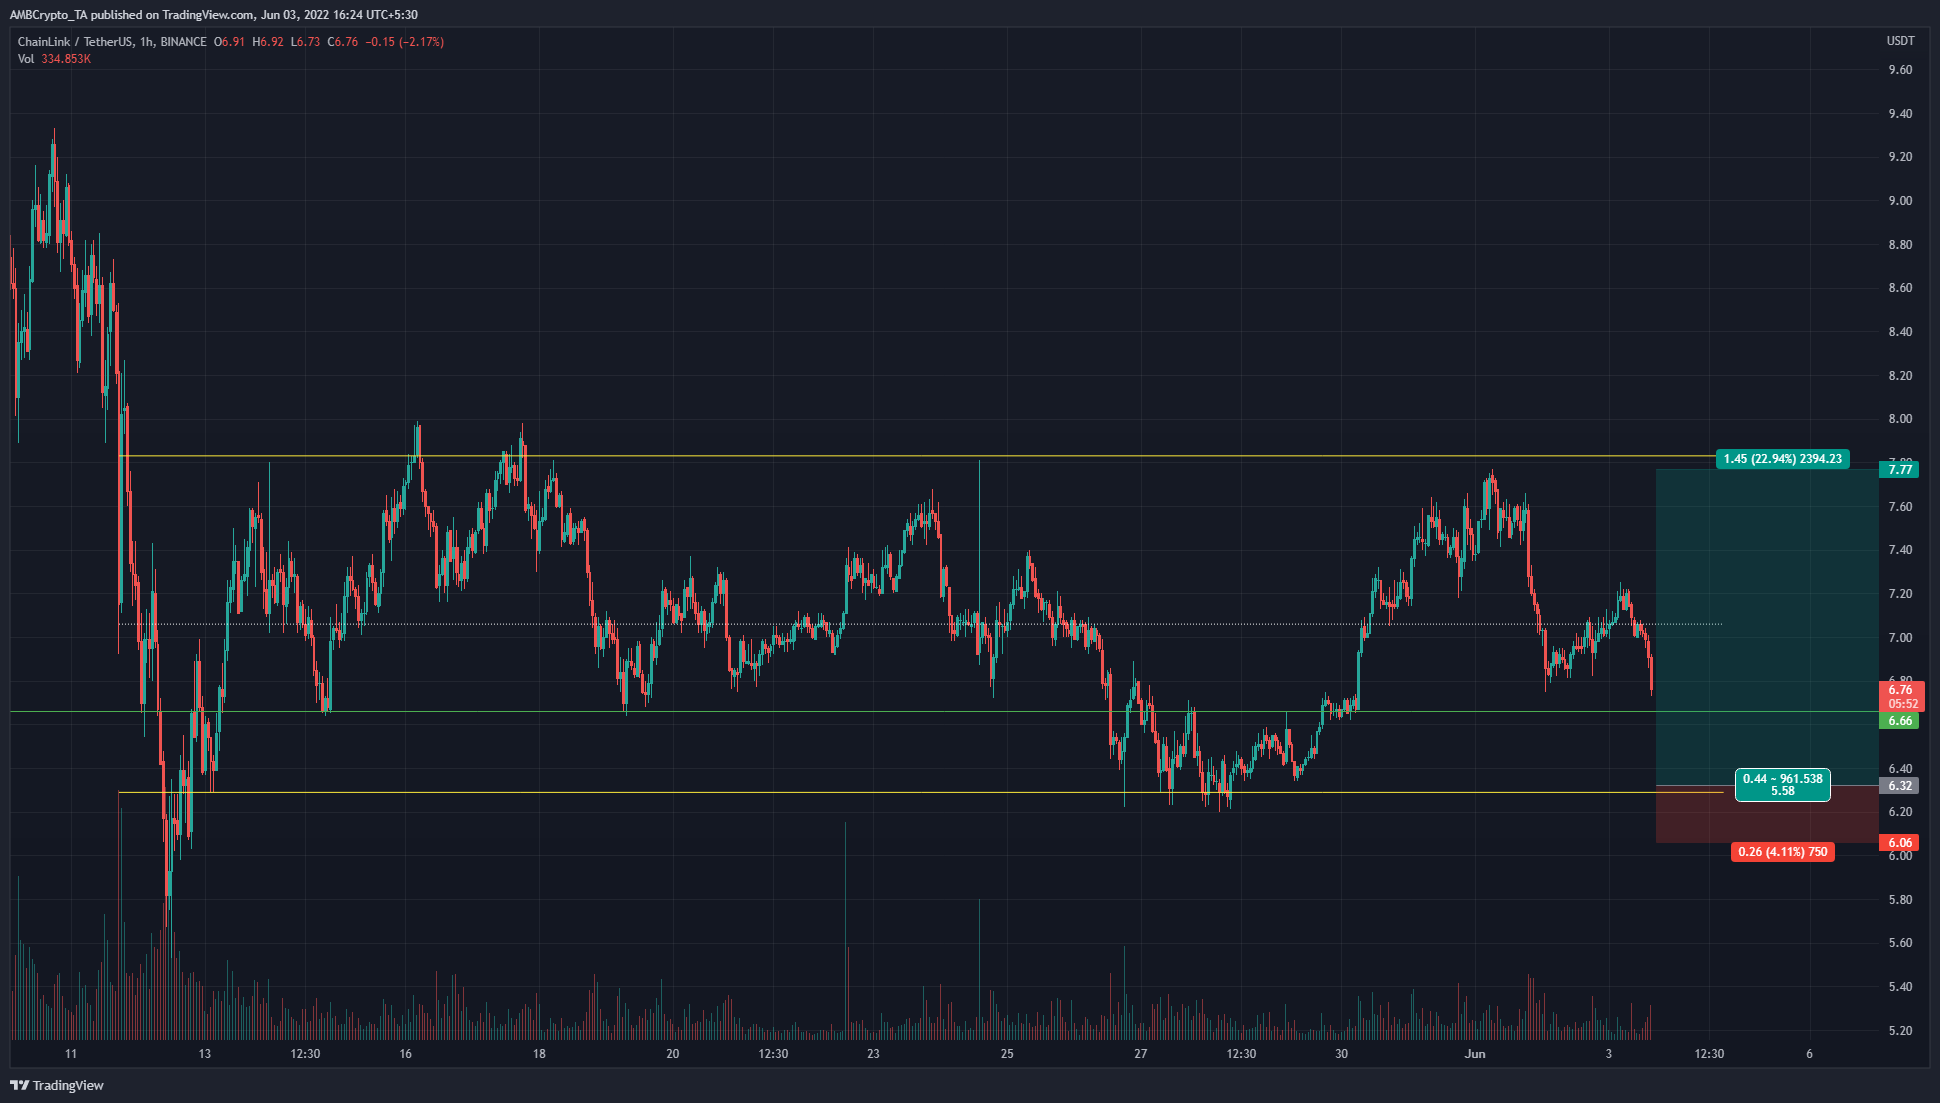
The H1 chart shows the range in sharper relief and highlights the rejection LINK faced at the mid-range. The lower timeframe also highlighted that the bullish market structure flipped to bearish when the price broke beneath the $7.18 mark. The uptrend from the range lows was broken, and a revisit of the range lows can offer a buying opportunity. However, a retest can not be blindly bought.
Early signs of a reversal such as the formation of a H4 bullish engulfing candlestick, or a morning star candlestick, can also be awaited. Bullish divergences can also improve the odds of a move upwards.
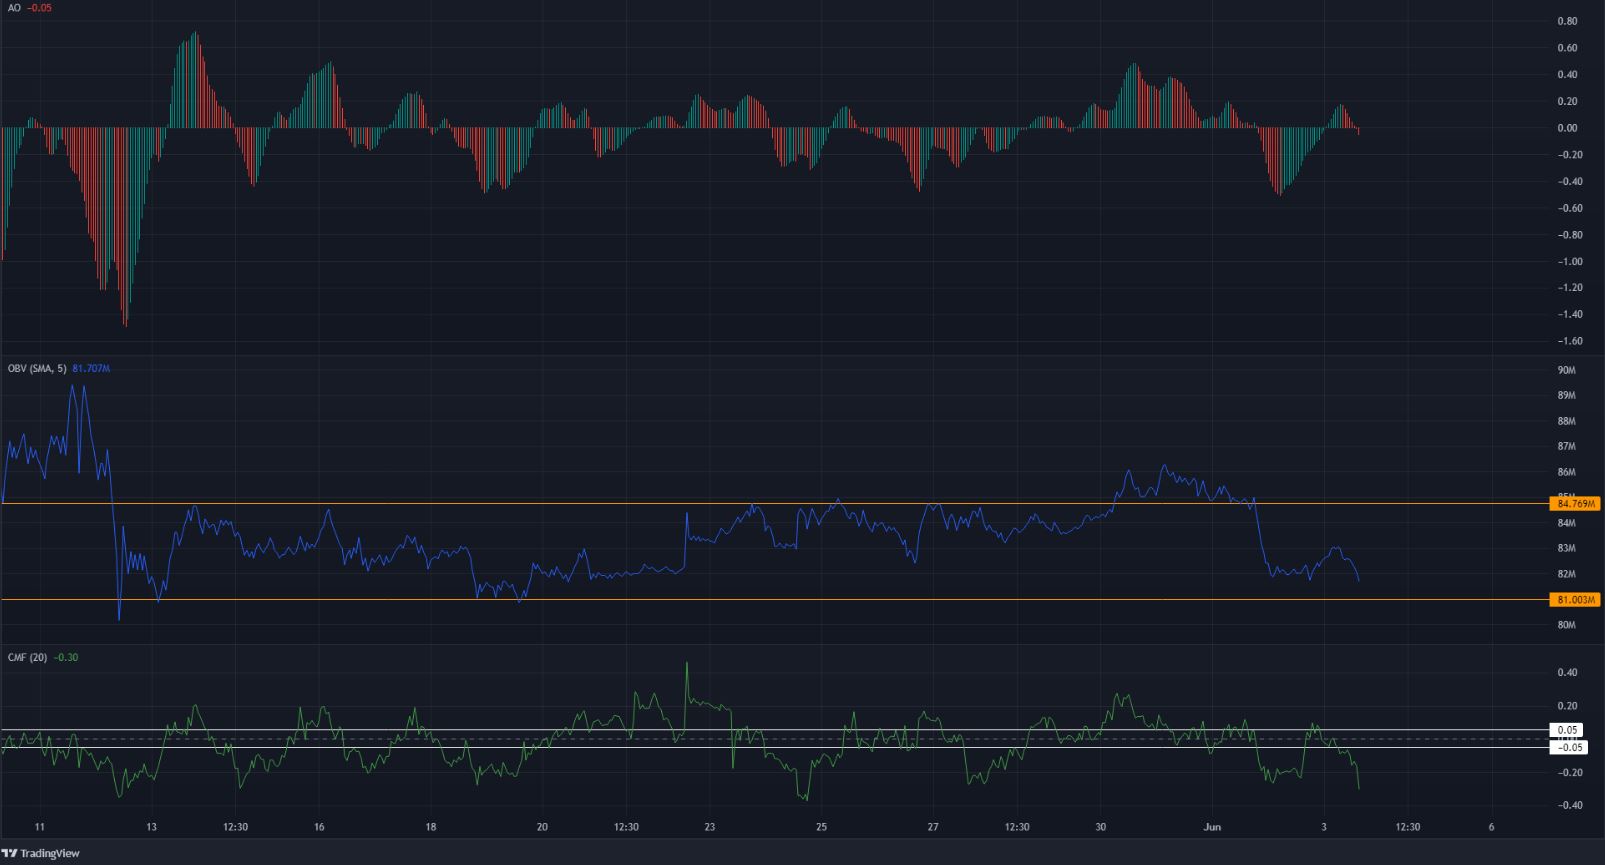
The OBV was stuck within a range, along with the price, and highlighted the balance between buyers and sellers. The CMF has oscillated in the past few weeks but has remained below -0.05 for a significant amount of time. This suggested that selling pressure had a slight advantage.
Look out for a bullish divergence on the AO hourly chart to enter LINK, as there is no hurry to enter the trade the first time the range lows are tested. However, more aggressive traders can look to enter and manage their position more carefully, although it could be risky without signs of a reversal materializing.
Conclusion
The OBV would need to remain within the highlighted range to improve the odds of a reversal upwards. The $6.32-$6.18 area can be used to assess an entry to a long position on Chainlink. If Bitcoin closes a session beneath $28.5k on the H4 chart, this long setup could be ruined. The range highs at $7.7-$7.8, as well as the mid-range at $7.06, can be used to take profit. A stop-loss below the $6.2 lows can be set.