Chainlink [LINK] beats its contemporaries, thanks to dApp activity

- Chainlink scored the highest in attracting developers to build on its network in the past six months.
- LINK might continue its free fall, regardless of its increased staking activity.
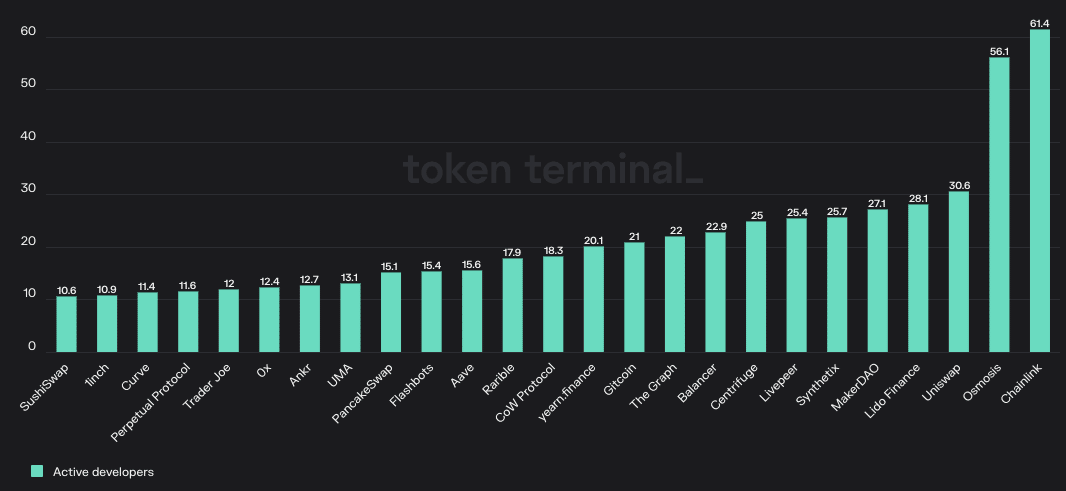
Decentralized oracle network Chainlink [LINK] topped the list of applications in terms of Decentralized Applications (dApps) development over the last 180 days, data from Token Terminal disclosed.
According to the information from the platform, LINK’s active developers based on dApp development were 61.4, beating the likes of Osmosis [OSMO] and Uniswap [UNI].
Read Chainlink’s [LINK] Price Prediction 2023-24
Chainlink undoubtedly deserved the feat, as evidenced by the numerous partnerships and integrations it had within the said period. While this could be considered an impressive performance, mainly due to the bear market, it had failed to reflect on LINK’s price.
According to CoinMarketCap, LINK’s 90-day performance had decreased by 28.08%. Moreover, LINK was unable to alter the trend as the price slid by 4.32%.
How long before the bears leave power?
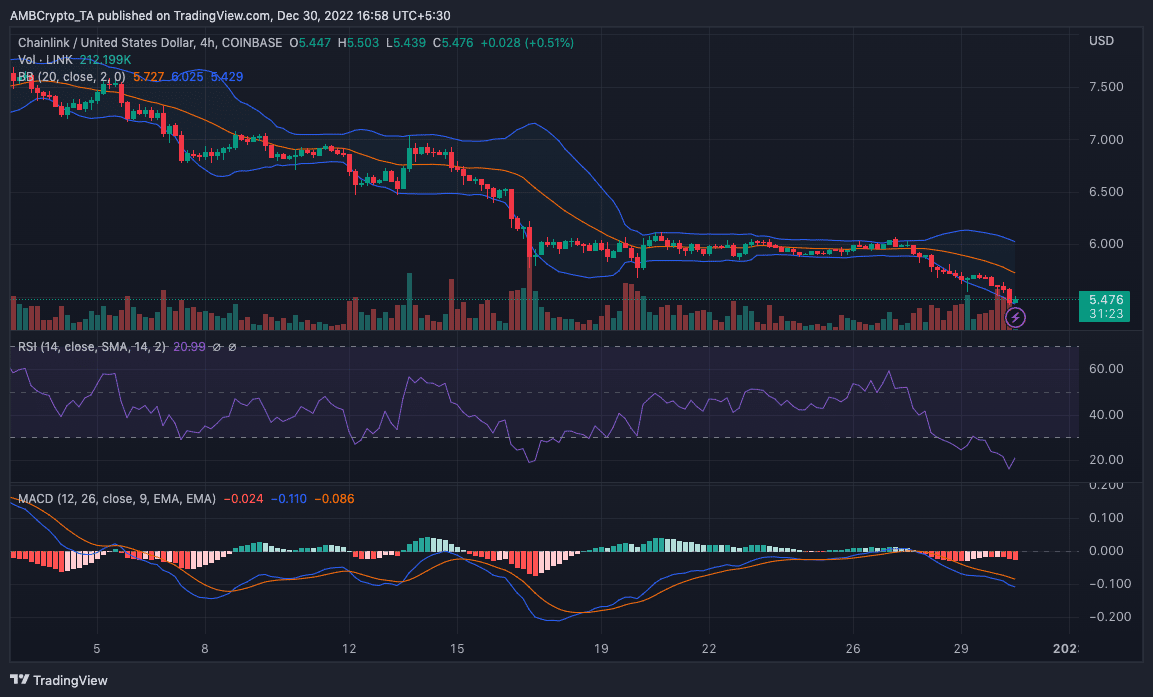
Indications derived from the four-hour chart showed that LINK had lost control to the bears. As revealed by the Relative Strength Index (RSI), LINK was languishing in the oversold region. Since it was down at 20.99, it implied that speed and price movement change failed to pass the bottom swing test. However, increased buying momentum might prove enough to trigger a reversal.
Per its volatility, LINK demonstrated extreme signs of unpredictability. This was because the Bollinger Bands (BB) left the low volatile region on 27 December. Moreso, the LINK price, at press time, trended towards the lower bands. This has been continuous since the date mentioned above, affirming the oversold condition revealed by the RSI.
With respect to the Moving Average Convergence Divergence (MACD), LINK approached potential entry points rather than a bullish move for gains. This was due to the selling (orange) and buying (blue) remaining below the histogram. This indicated a bearish momentum while avoiding clarity for buy triggers. In the interim, LlNK might continue decelerating.
Still, keep the supply running
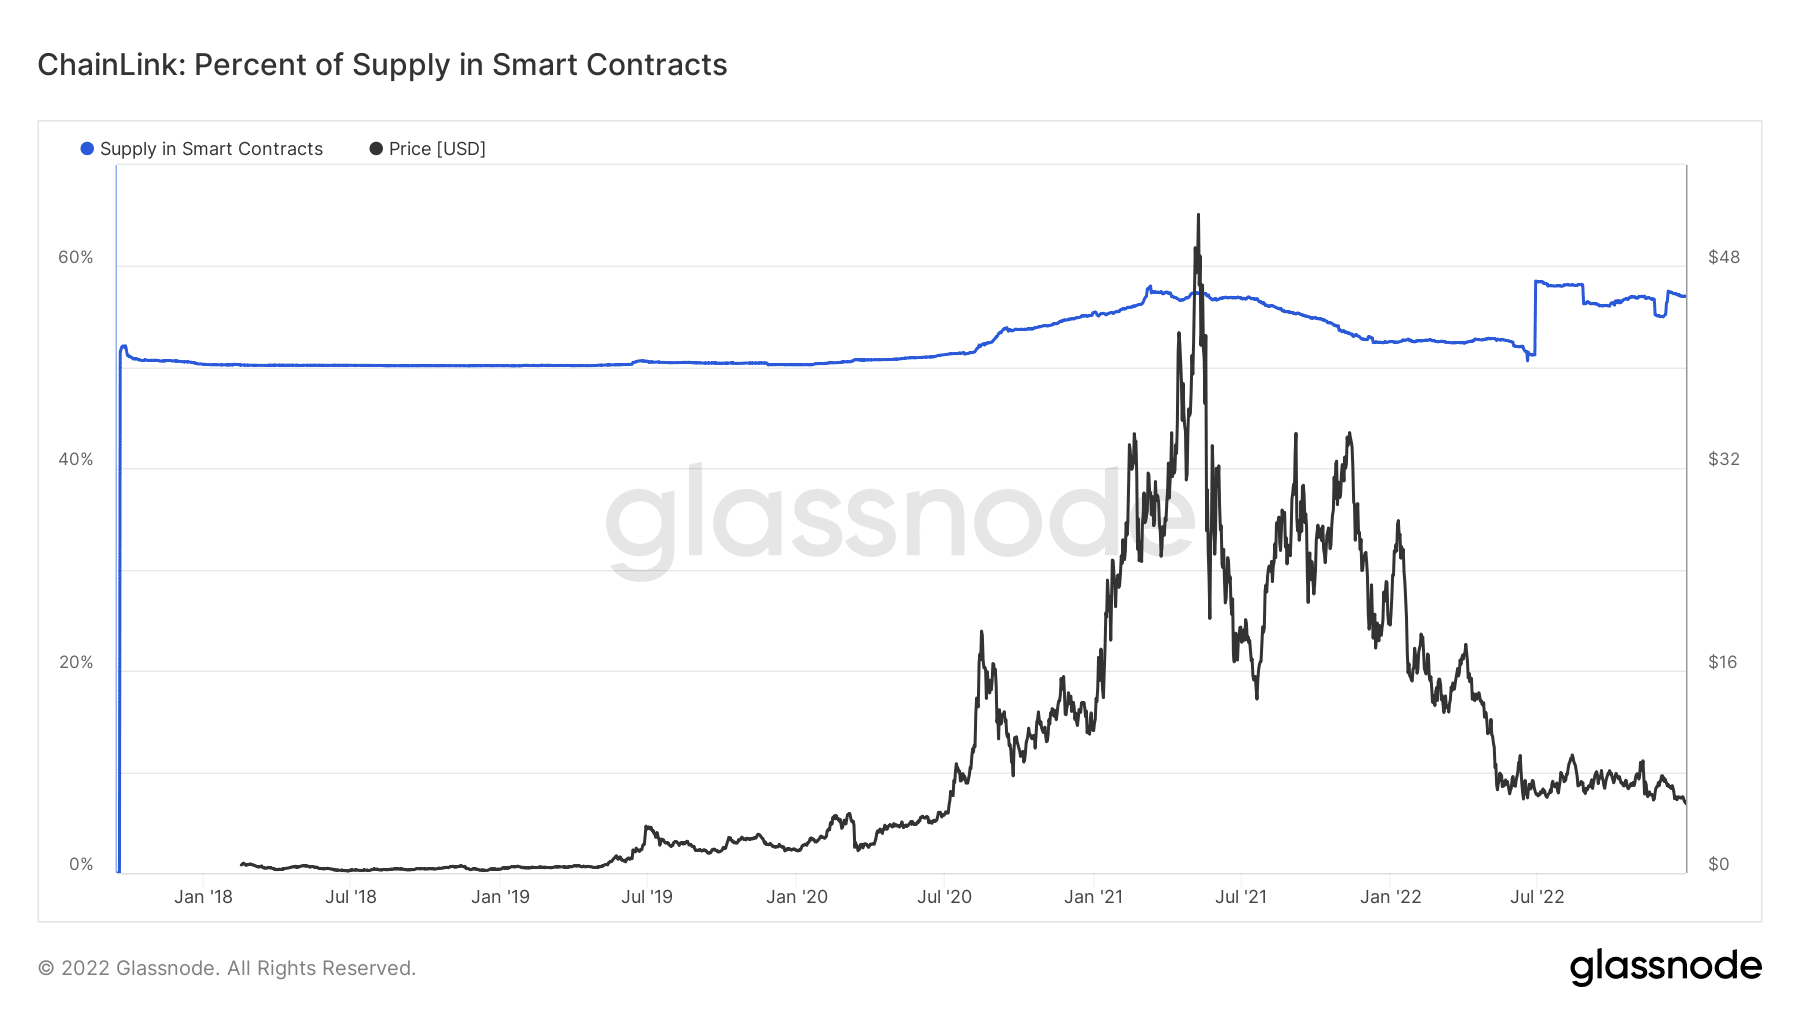
Based on its on-chain data, Chainlink kept its smart contracts’ influence in check. Glassnode’s data showed that LINK’s supply in smart contracts had recovered from the drop in June 2022. As of this writing, the supply was 57.04%. This meant that users preferred to engage LINK in staking activities instead of waiting for a suitable buying opportunity.
Besides, not much was happening with LINK per exchange activity. At press time, Glassnode revealed that both exchange inflow and outflow were at low levels.


