
Disclaimer: The findings of the following analysis are the sole opinions of the writer and should not be taken as investment advice
Chainlink’s price has seen prolonged sideways movement over the past month. However, its trend seems to have changed lately, with the altcoin now noting a hike in bullish momentum. Since the start of March, LINK has been on a recovery run to get back to the price point last seen on 20 February. At the time of writing, LINK was quite close to touching the aforementioned level once again.
At press time, LINK was trading at $30.2 after having seen its value appreciate by over 17 percent over the past week. LINK had a market capitalization of $12.6 billion and a 24-hour trading volume of $1.6 billion.
Chainlink 1-day chart
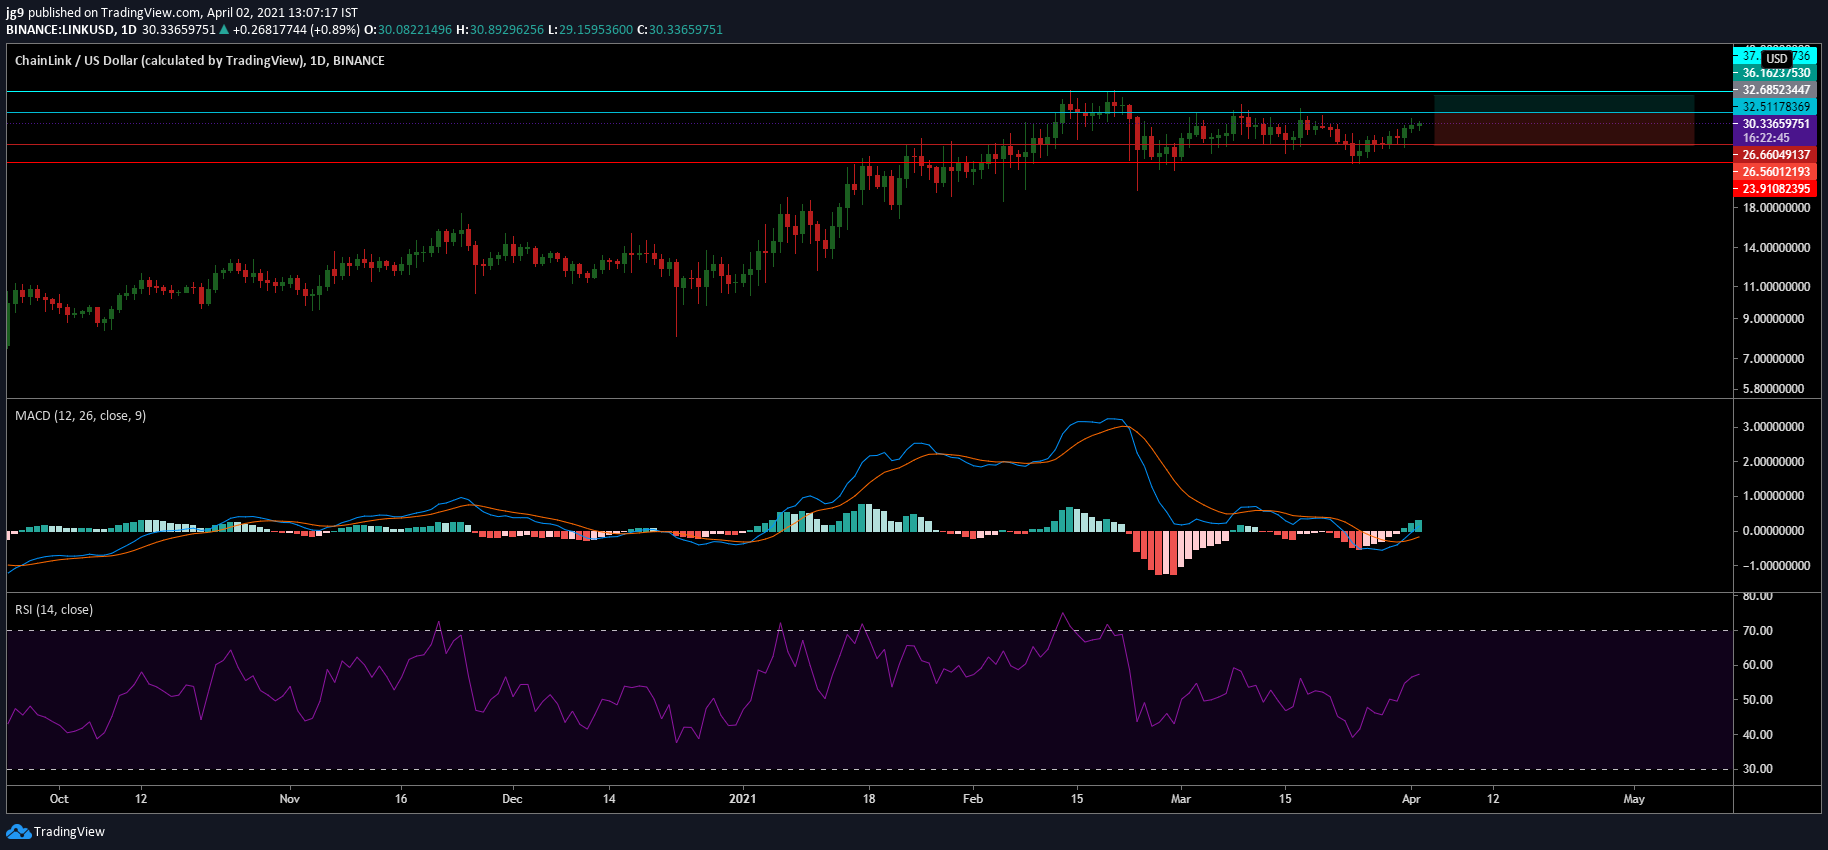
Source: LINK/USD, TradingView
Strong bullish momentum has been visible in the Chainlink market since the last week of March. 25 March saw a trend reversal and since then, the bulls have been in control. The altcoin, at press time, was continuing its surge, with the alt close to breaching the resistance at $32.5. If this level is flipped to support in the coming 24-hours, then LINK is likely to head towards the $37-level in the coming week.
However, if yet another price correction takes place and LINK trades lower, then there will be two key levels of support at $26.6 and $23.9. The altcoin will be able to count on these levels to help stabilize its price and arrest the bearish momentum.
Given the upward movement of the cryptocurrency, traders can benefit from long positions and can take profit around the second level of resistance. This would be applicable if LINK is able to breach its immediate resistance in the short term.
Rationale
Chainlink’s technical indicators painted quite a bullish picture on the charts. The MACD indicator underwent a bullish crossover while the MACD line continued to remain well above the Signal line. In the case of the RSI indicator, it was observed to be a little above the neutral zone, but was moving in the direction of the overbought zone. This highlighted how the buyers have been dominating LINK’s market.
Important levels to watch out for
Resistance: $32.5, $37.2
Support: $26.6, $23.9
Entry: $32.6
Stop loss: $26.5
Take profit: $36.1
Risk/Reward ratio: 0.56
Conclusion
Chainlink has now built up adequate bullish momentum and it may soon breach its immediate resistance. In such a scenario, the coin’s target in the coming week is likely to be the $37-price level and in such a scenario, traders can benefit from opening long positions.
However, if the alt’s price sees another short-term correction, then LINK may dip to around $26.6 in the coming week.