
Polkadot and Dash approached a strong level of resistance with bullish momentum, and the next day or two will reveal whether the market’s bulls have the impetus to drive prices higher. Ethereum’s brief breach of $2,000 could possibly be a bullish influence on the market’s altcoins. Finally, Aave sought to flip the $390-region from supply to demand.
Polkadot [DOT]
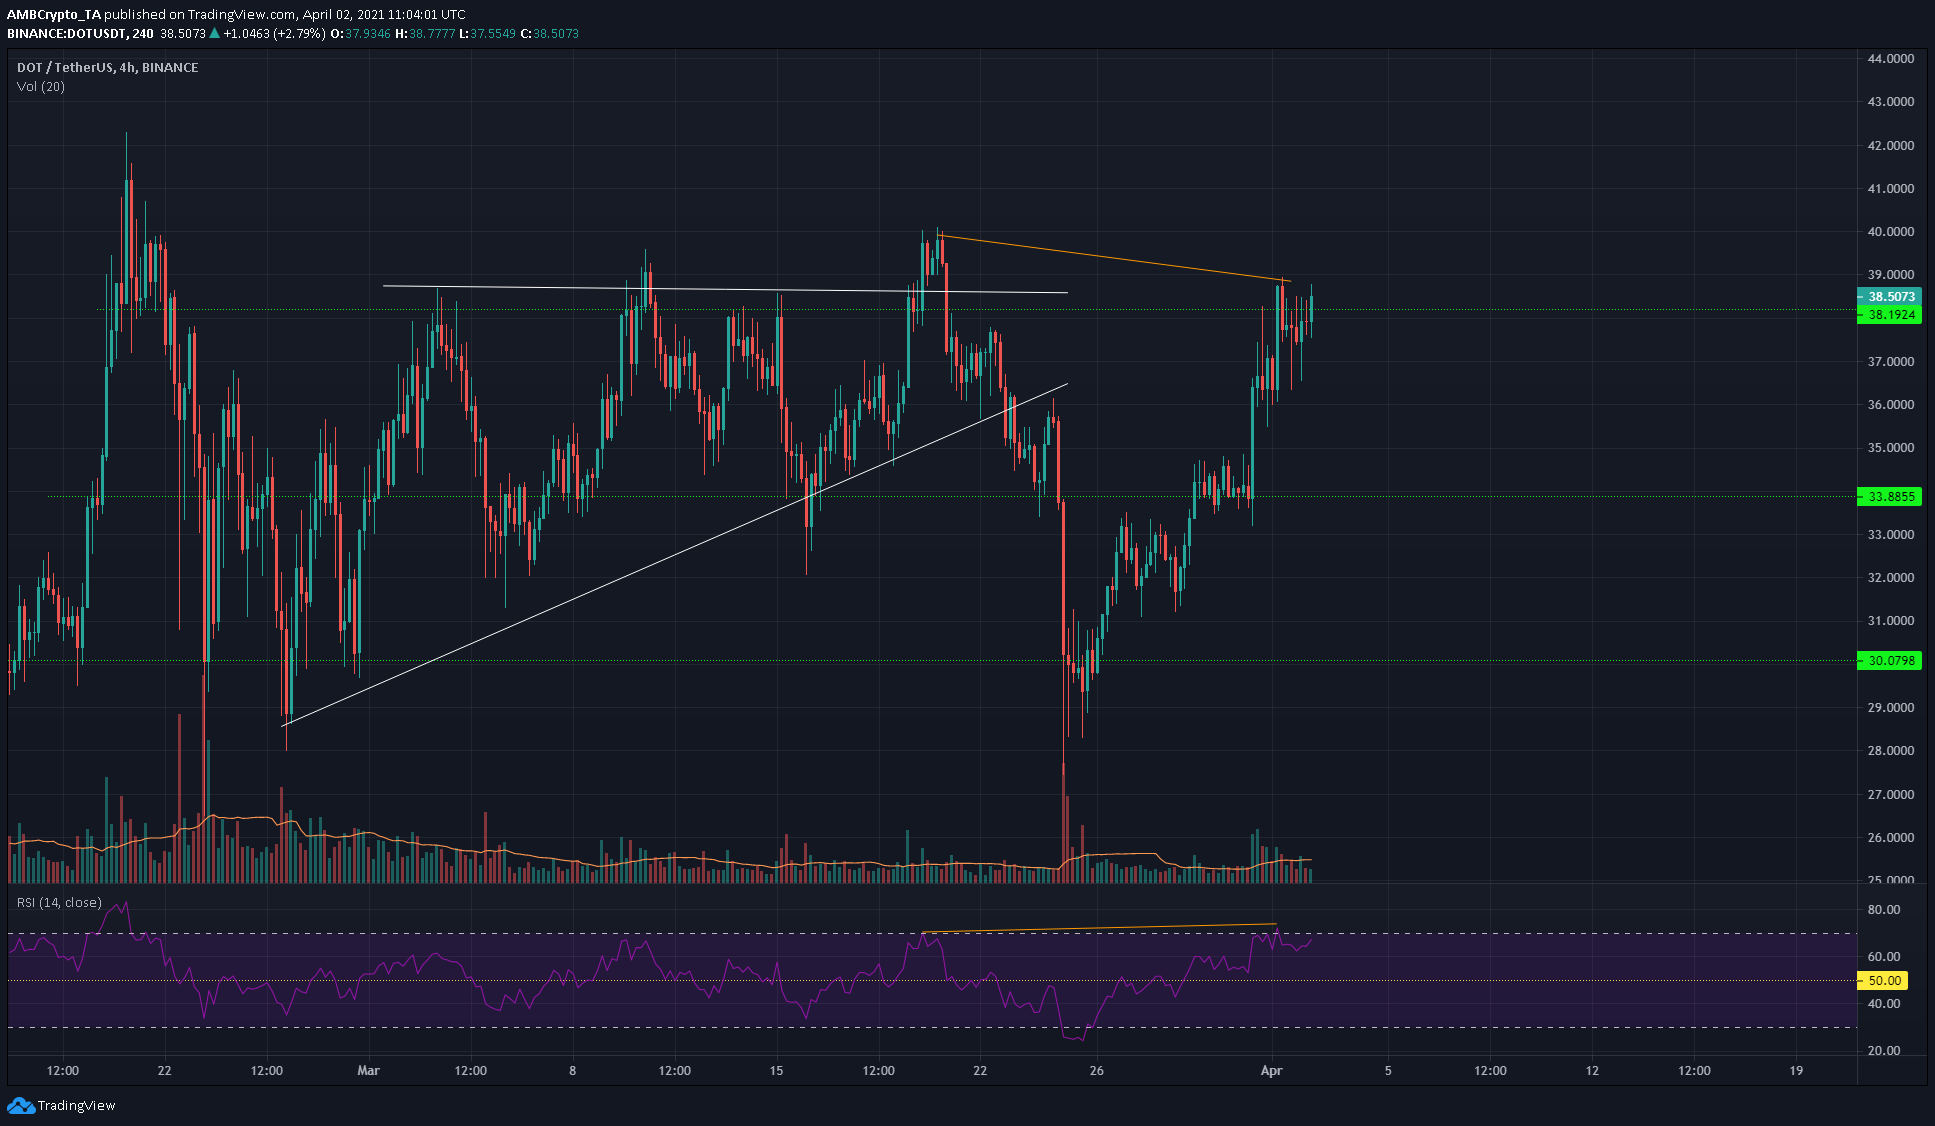
Source: DOT/USDT on TradingView
Highlighted in orange is a hidden bearish divergence between the price and the momentum, one that saw DOT pull back from $38.8 to dip as low as $36.4 before pushing upwards once more. At the time of writing, DOT was trading above the $38.2-level of resistance, and this level could be retested as support in the next couple of days.
After the corrective dip, the RSI was climbing higher once more. DOT’s prices recovered from the breakdown from the ascending triangle pattern (white), with the bulls pushing for the $40-mark, and eventually towards the ATH at $42.
Aave [AAVE]
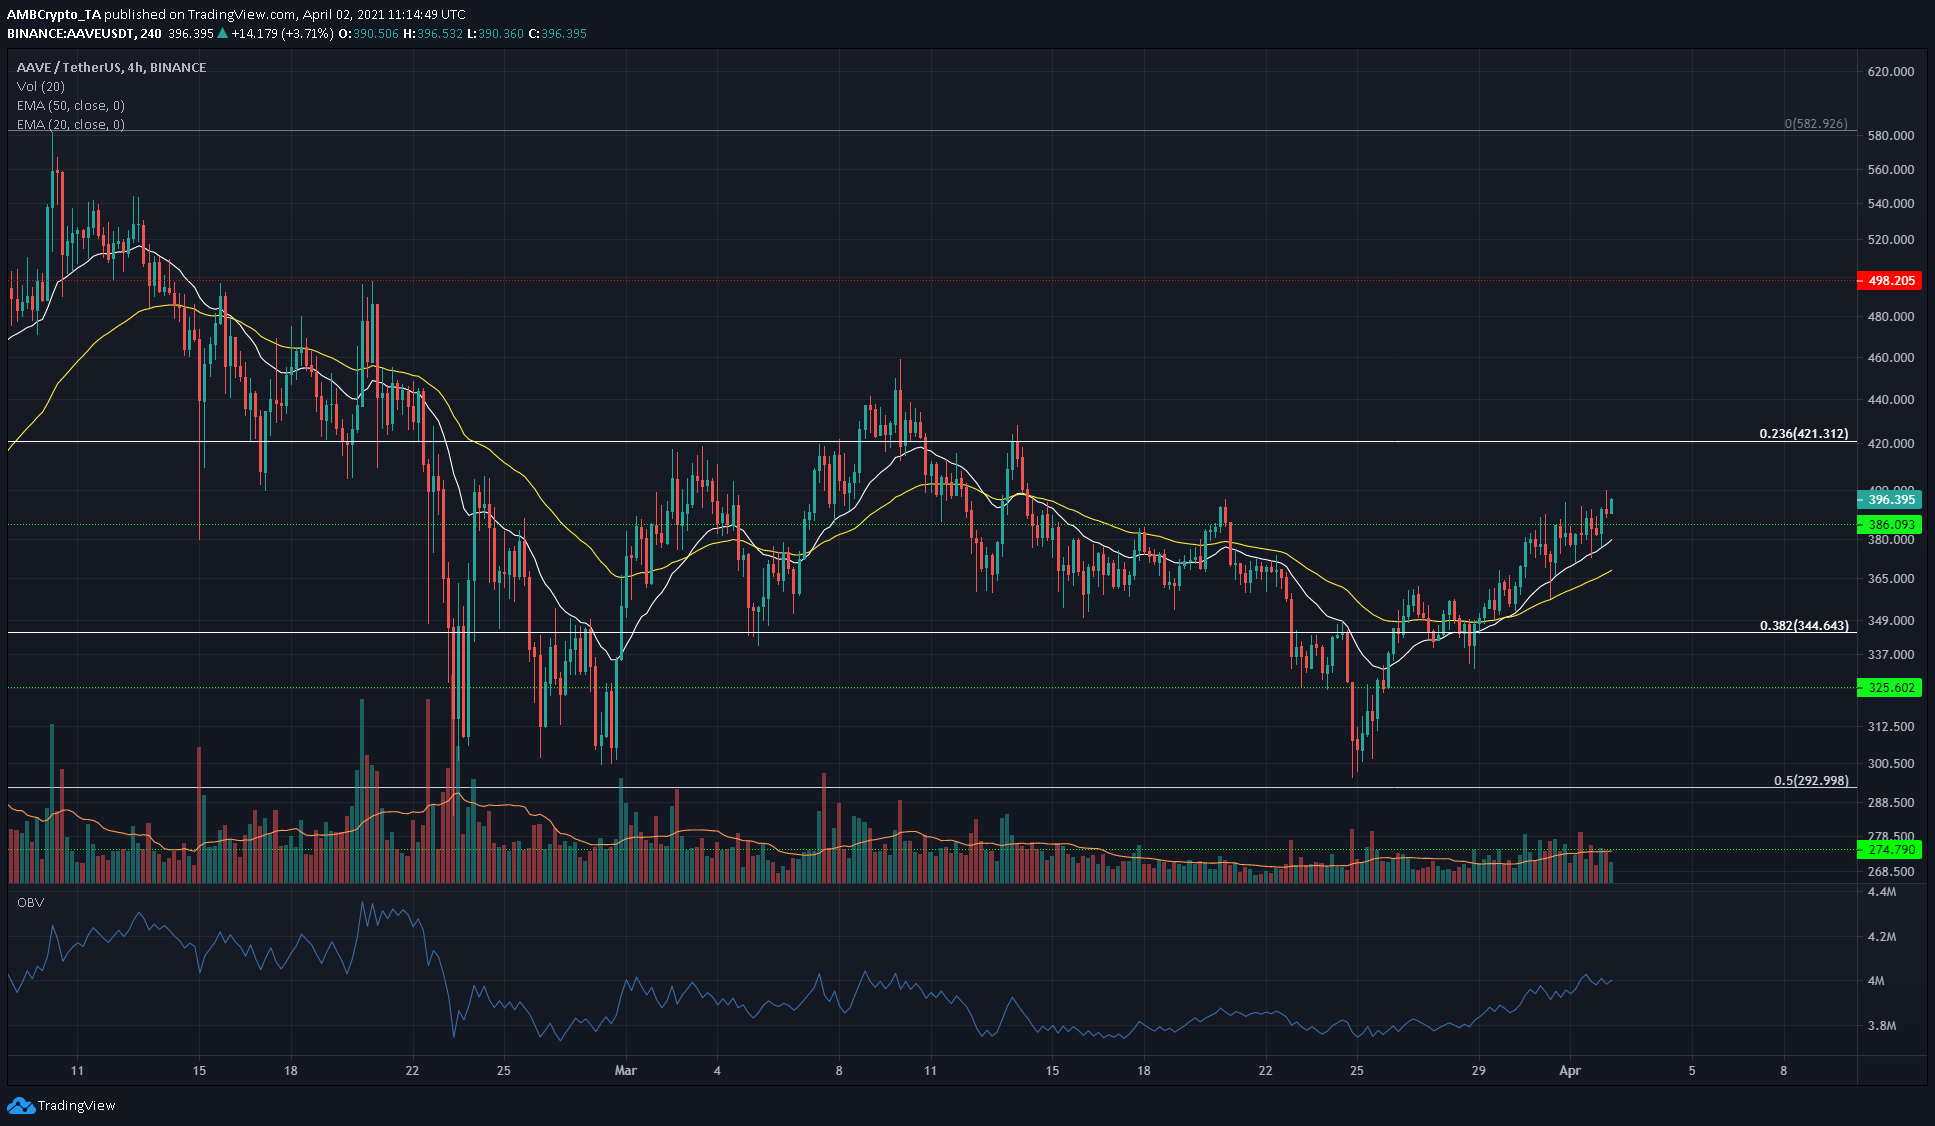
Source: AAVE/USDT on TradingView
The 20-period EMA (white) was moving above the 50-period EMA to show that recent momentum for AAVE has been upward, and the 20 EMA has also seen buyers step in to drive prices higher. The $386-$390 resistance looked to have been breached in recent hours of trading.
The trading volume was not insignificant, and the OBV showed that the past week has seen buying volume outweigh the selling volume. Whether this trend can continue in the weeks to come will determine if AAVE can hike past $421 and towards $500. Flipping $390 to a region of demand would be the first step.
Dash [DASH]
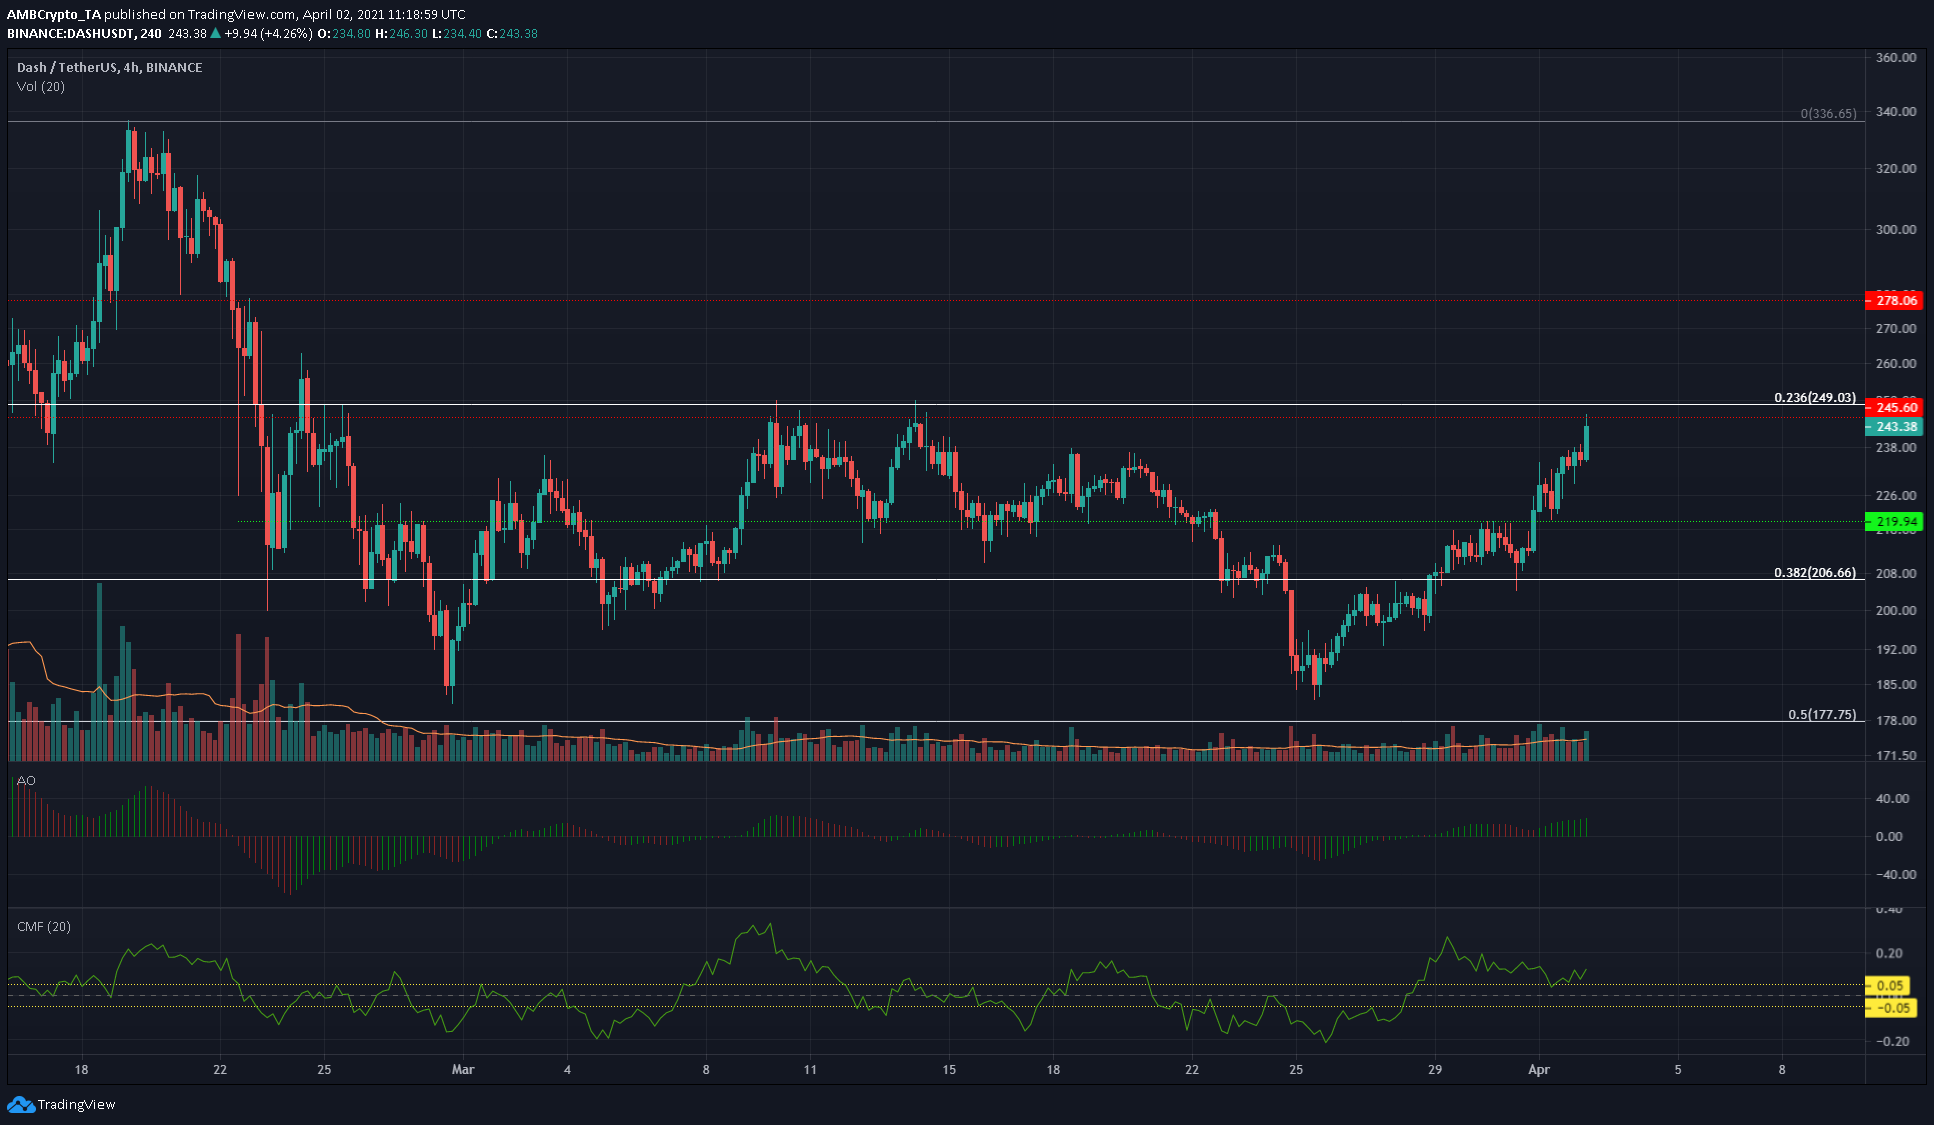
Source: DASH/USDT on TradingView
DASH too approached a strong level of resistance with bullish momentum. The $245-resistance level has been tested twice already in the past month, and the price faced rejection on both attempts.
The Chaikin Money Flow was above +0.05 to show net capital flow into the market, and the Awesome Oscillator showed bullish momentum.
A Doji, hanging man, or a bearish engulfing candlestick pattern, at resistance in the coming hours would point to another rejection for DASH, while a session close above the $249-level would signal further upside.