Chainlink, STEEM, Maker Price Analysis: 02 February

LINK seemed to be targeting a move above its $24.29-resistance, but weak momentum meant that the market’s bulls could struggle to lift the price on the charts. Healthy buying activity and an uptick in trading volumes backed STEEM for a rise above its $0.19-resistance. Finally, MKR’s bearish cycle could spill over to the next few sessions if the price falls below the $1,352-support level.
Chainlink [LINK]
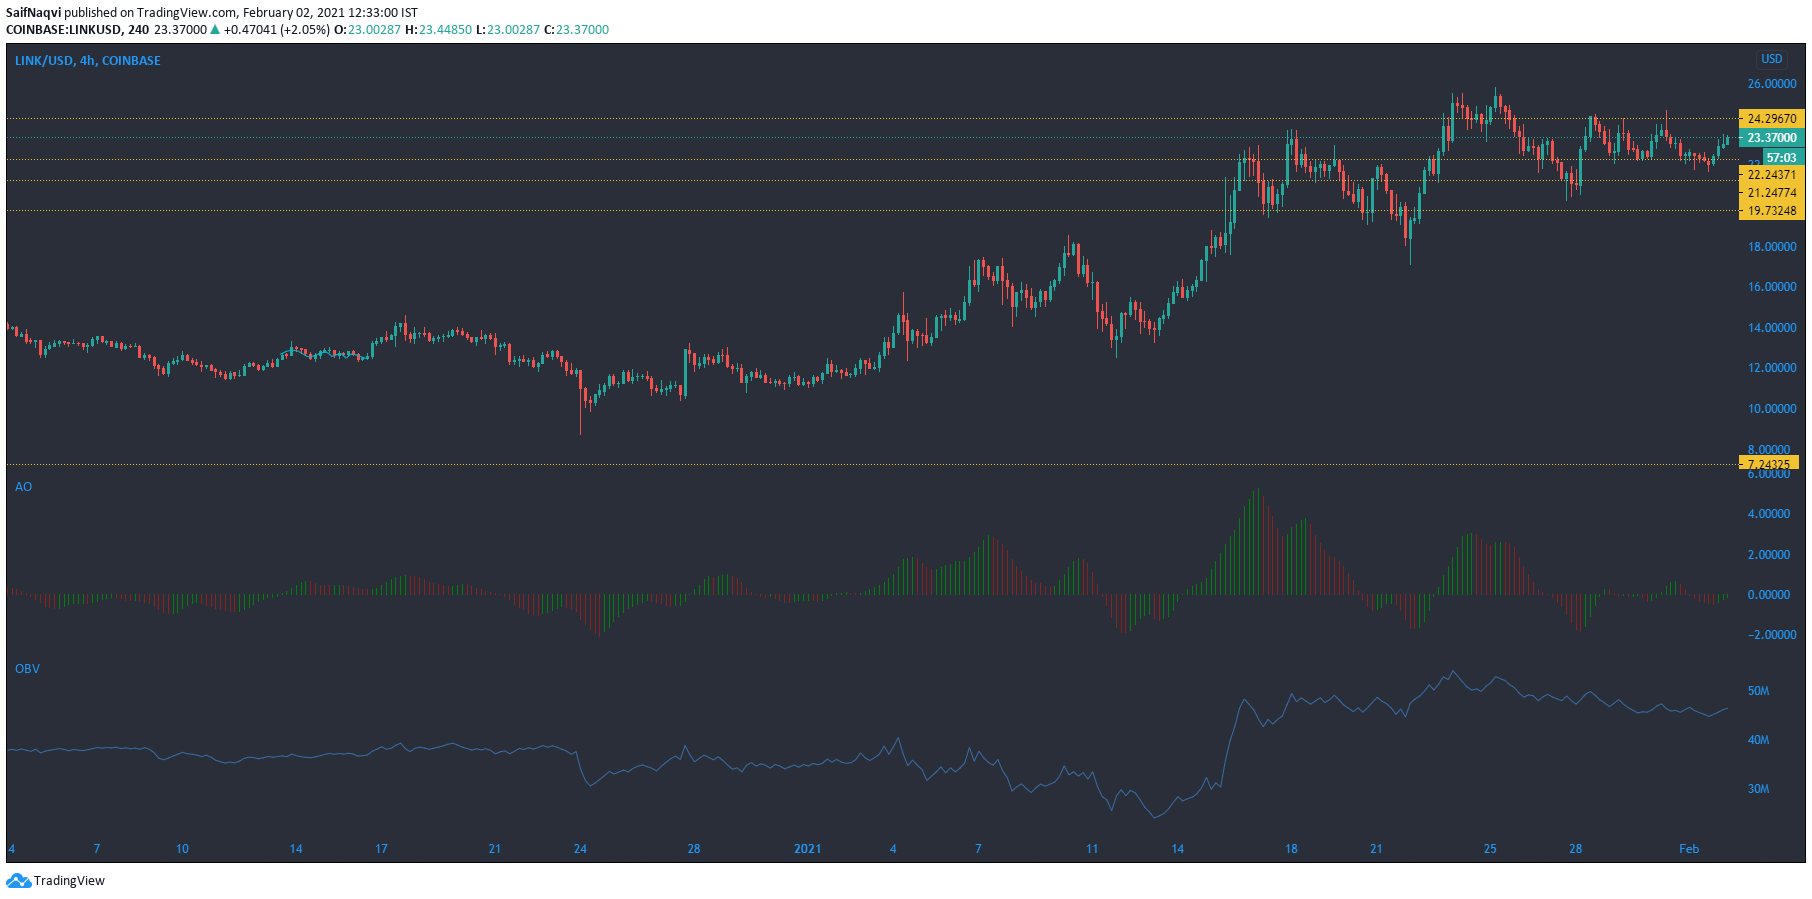
Chainlink moved north after testing the $22.2-support level as the cryptocurrency registered some buying pressure over the past few sessions. The world’s seventh-largest cryptocurrency by market cap, Chainlink was up by 3.3%, at press time. The movement could present an upside at $24.29, but a break above this mark seemed unlikely as momentum was weak in the market. This was backed by the Awesome Oscillator which showed that momentum was low on the bullish side.
The On Balance Volume noted a slight uptick and pointed to some buying activity as the price picked up from the $22.2-support. However, buyer numbers fell over the past week as the OBV constantly hit lower lows on the charts. In the short-term, LINK could trade between its immediate support and resistance levels.
STEEM

STEEM was bullish, at the time of writing, as the price eyed a move above its $0.19-resistance. Since the 24-hour trading volumes registered an uptick and buying activity picked up over the last 24 hours, STEEM made a strong case for a move above its immediate upper ceiling.
The Stochastic RSI also supported a bullish outcome as the index was pointing towards the overbought zone. The Chaikin Money Flow moved above zero and showed that capital was flowing into the crypto-asset. In a bearish scenario, the 200-SMA (green) could act as a buffer against the price drop.
Maker [MKR]

The Bollinger Bands on Maker were compressed and highlighted low volatility in the price. In fact, a period of low volatility was the norm over the last 7 days as the price moved between $1,352 and $1,563.5. The Parabolic SAR’s dotted markers were above the candlesticks and suggested that MKR was on a downtrend for the past couple of sessions.
A breakout above the upper barrier at $1,563 would mark a bullish reversal, but this seemed unlikely as the trading volumes dropped by 13.5% to $160 million. On the flip side, a fall below the press time support level would signal an extended bearish market for MKR.