Chainlink, VeChain, EOS Price Analysis: 02 January

As the broader market slightly improved over the past day, Chainlink crossed the $20.86-mark after depicting a marginal bullish preference. Further, VeChain headed to test its immediate resistance but failed to gather enough volumes.
EOS rose above its 20-SMA and now found an immediate hurdle at the 50-SMA and its RSI resistance.
Chainlink (LINK)
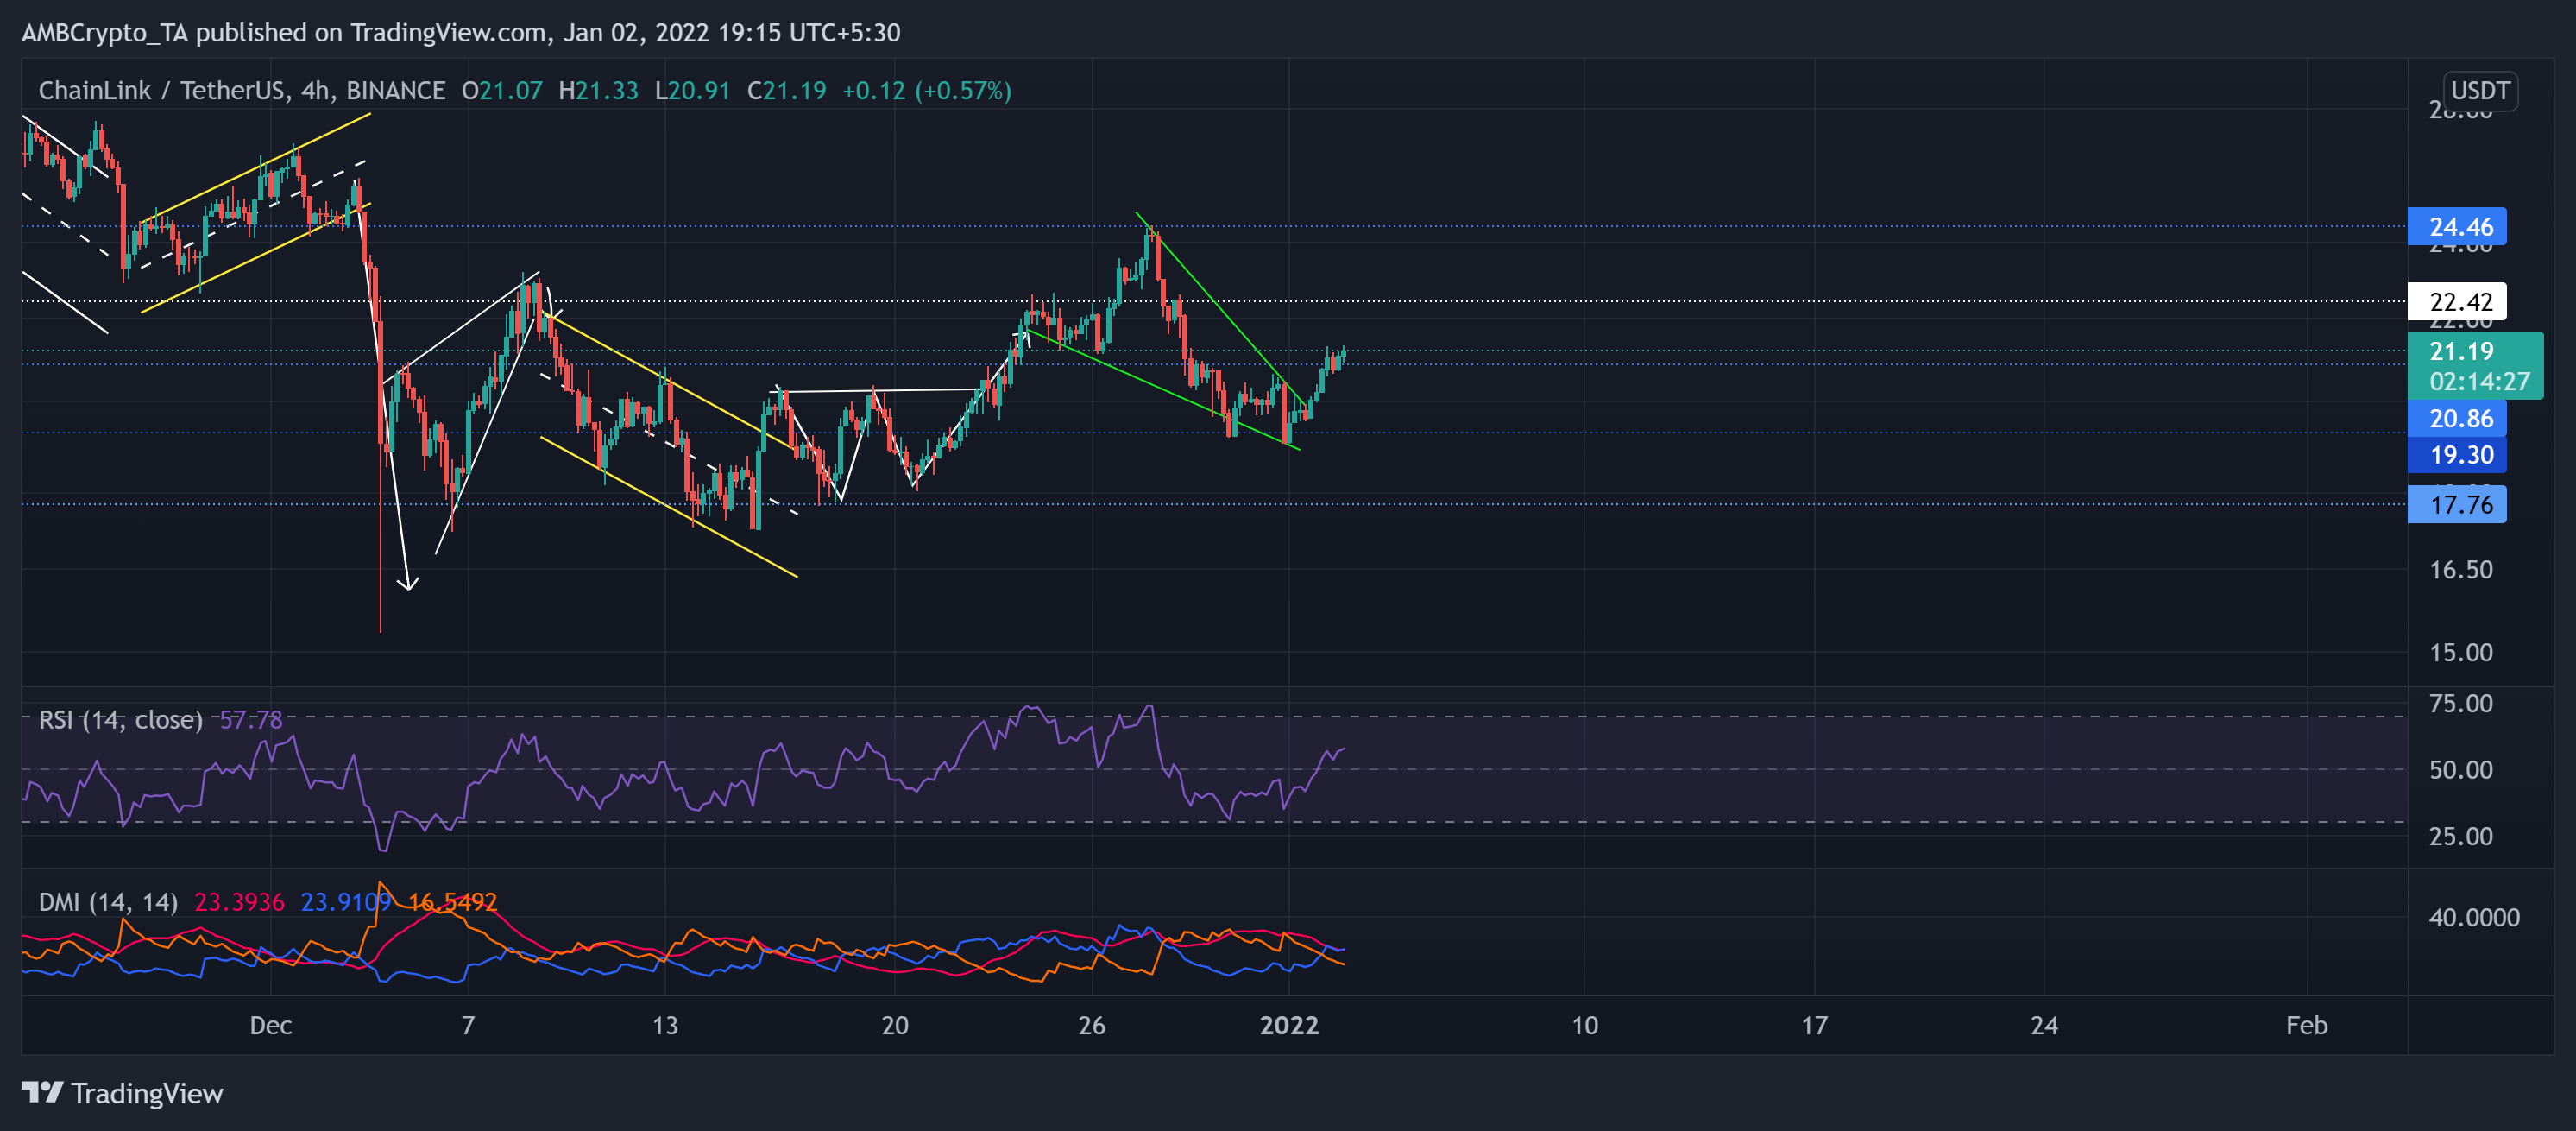
After witnessing a bearish rising wedge breakdown on 9 December, the price action transposed in a down-channel (yellow) and tested the support at $17.7 nearly seven times before forming a double bottom. Then, the alt saw a staggering 35.53% ROI (from 20 December low) until it touched its three-week high on 27 December.
Over the past week, the alt declined in a falling wedge (green) while the bulls ensured the $20.8-support. The recent breakout propelled a 24-hour 10.43% incline. Now, the immediate resistance stood at the $22.42-level.
At press time, LINK traded at $21.19. The RSI was in a clear uptrend after choosing the bulls. Also, the +DI looked north, but the ADX displayed a slightly weak directional trend.
VeChain (VET)

After ensuring the five-month support at $0.076-mark, VET finally let go of its long-term bearish trend resistance (since 9 November, white).
This retrieval attempt marked a rising wedge (green, reversal pattern) on its 4-hour chart. However, the price action found $0.100-mark as resistance since the beginning of this month.
As a result, it saw a 20.37% breakdown from 27 to 30 December. Over the past three days, VET found an oscillating range between $0.08783 and $0.08157-mark.
At press time, the alt traded at $0.08699. Since 30 December, the RSI was northbound as it recovered from the oversold region. The MACD histogram depicted an increasing buying pressure. But its lines were still under the equilibrium. Besides, the Volume Oscillator marked lower peaks and displayed a weak bullish move. Now, the immediate testing point for the bulls stood at $0.087-mark.
EOS
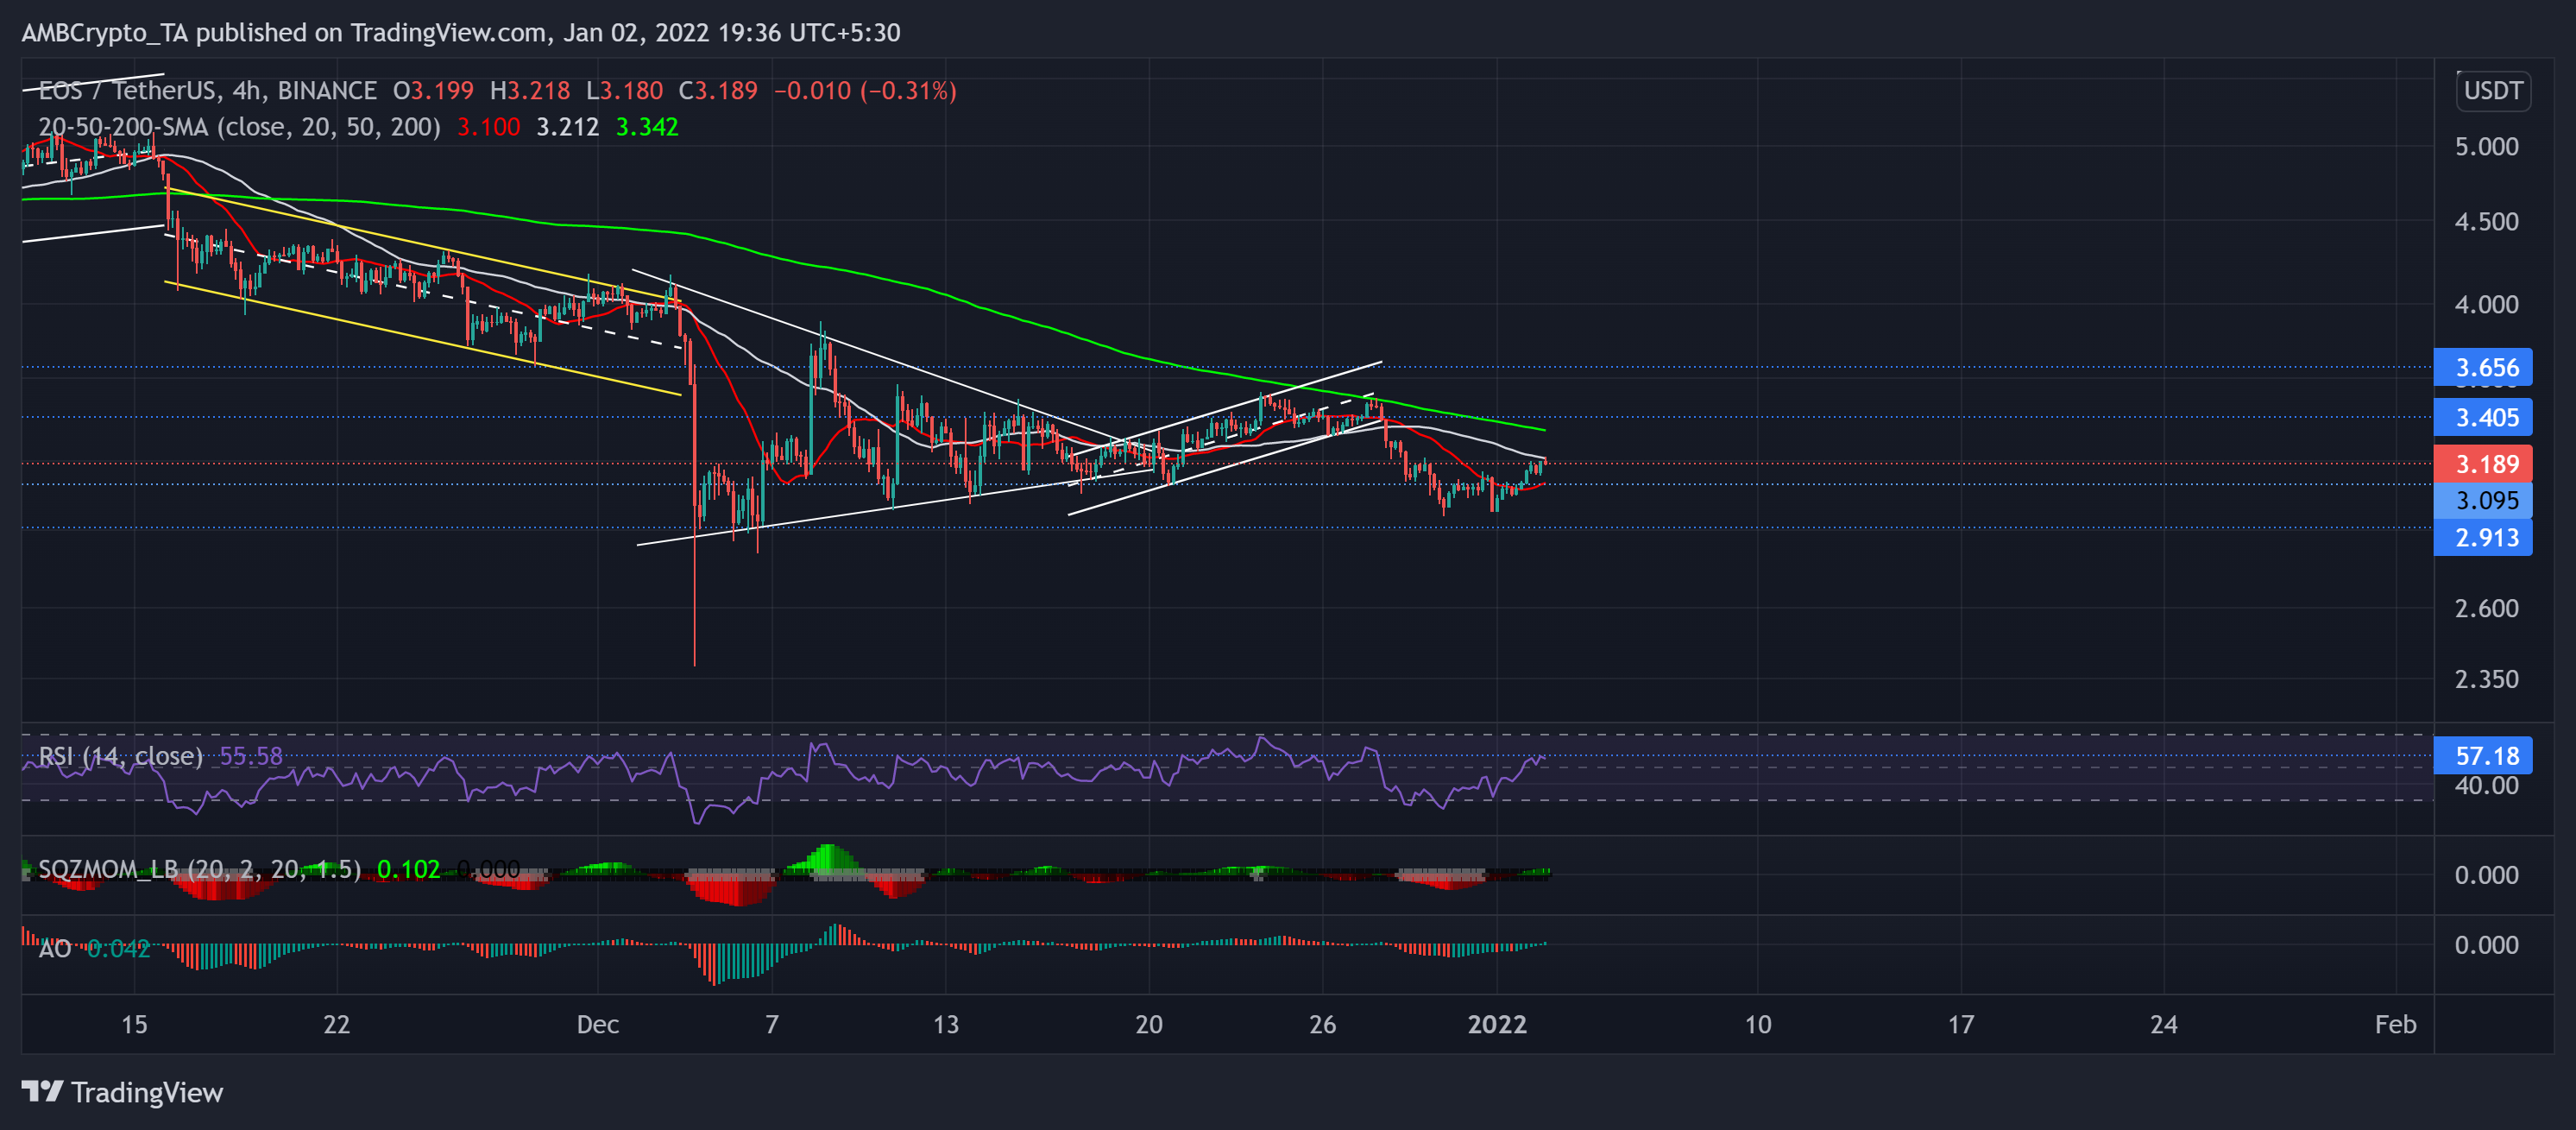
EOS saw a symmetrical triangle breakout on 20 December. The bears retested the $3.09-level multiple times, but the bulls held their ground. Although they propelled an over 12% rally (from 20 December low) and breached the $3.4-mark, EOS saw a pullback from the 200 SMA (green).
The alt yet again found an oscillating range between $3.4 and $3.09 over the past month.
At press time, EOS was trading at $3.189. The RSI finally recovered above the midline but saw a pullback from the 57-point resistance. Also, the Awesome Oscillator visibly depicted an increased buying influence. Now, the Squeeze momentum indicator flashed black dots and hinted at a low volatility phase.