Chainlink’s short-term fortunes may be dependent on this defensive zone

Disclaimer: The findings of the following analysis are the sole opinions of the writer and should not be taken as investment advice
Chainlink’s progress above $27.4 seemed to be undone due to a fresh round of selling pressure. The alt’s price, at press time, was below the 4-hour 20 and 50 SMAs as short-term control belonged to the sellers.
On the other hand, buyers can revive LINK above the defensive zone of $24.6. This would involve accounting for a symmetrical triangle on the charts.
At the time of writing, LINK was trading at $25.73, down by 6% over the last 24 hours.
Chainlink 4-hour chart
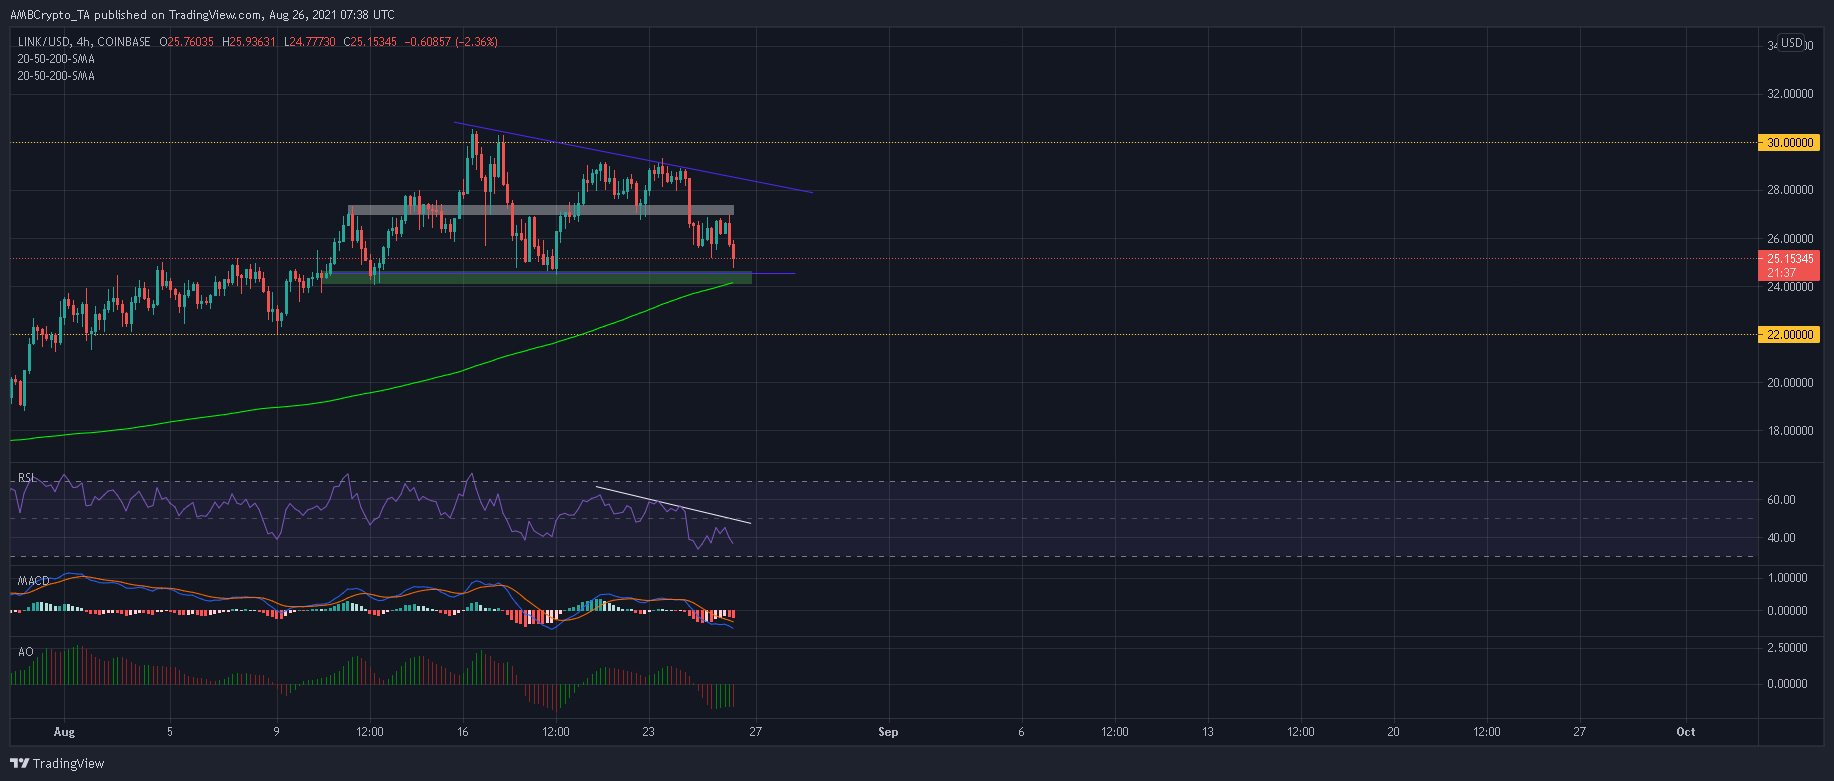
LINK’s advance above the important resistance zone of $24.60-$24 on 20 August was expected to have a more dramatic effect on the market. However, gains were held just below the $30-mark. Buyers did attempt to breach this ceiling on two separate occasions but failing to do so invited sellers back into the mix.
A drawdown seemed to be in effect and the market was having flashbacks of its retracement between 17-19 August. Moreover, a third low formed at $24 would present a descending triangle, one from where the market would be vulnerable to another pullback.
For buyers, not all hope seemed lost, however. A second low formed at $24.6 and would give rise to a double bottom formation. This can be considered a bullish development.
Moreover, an immediate reversal and consolidation around $27 would result in a symmetrical triangle. This setup could trigger a break to the upside if it plays out as a continuation of LINK’s previous uptrend.
Reasoning
Before assessing the possibilities of a reversal, it is important to outline an extended decline, especially since the indicators sided with the sellers.
The Relative Strength Index was yet to breach oversold territory and lined up a few more losses for LINK before a bullish comeback. A similar notion was spotted across the MACD and the Awesome Oscillator. Both did progress slightly over the last few sessions but traded well below their respective half-lines.
If sellers push for a close below $24 and the 200-SMA (green), expect additional drawdowns over the coming days.
Conclusion
LINK’s indicators presented chances of further bleeding and a close below $24 could end up being catastrophic for LINK’s bullish narrative. A descending triangle breakdown could trigger another 10% decline towards $22.
This is why the $24.60-$24 support is crucial to LINK’s trajectory. If the market does see a price reversal, the aforementioned zone would have a huge role to play.


![Ethereum [ETH] — institutions buy in while retail sells into the weekend](https://ambcrypto.com/wp-content/uploads/2026/07/IMG_4102-e1783831532449.webp)