Chances of high volatility in the coming week? But DOT could defy the trend

Since striking its all-time high on 4 November, Polkadot (DOT) bears were in the driver’s seat as DOT declined between southbound parallel lines (yellow). The most recent fall pushed the alt below its six-month-long trendline support (now resistance).
A sustained close below its Point of Control (red) near the $17.2-mark would heighten the chances of further downfall. This fall would likely see a clash between the buyers and sellers in the $17-$14 range before a trend committal move. At press time, DOT traded at $17, down by 4.5% in the last 24 hours.
DOT Daily Chart

The latest bearish phase (from its ATH) led the alt to lose more than 71% of its value and plunge toward its 25-week low on 24 January. As the Point of Control served as a strong buying zone, DOT reversed to form a bearish flag on its daily chart.
While the bearish flag plunged below the six-month-long support (now resistance), the current price was still not overstretched from its 20-50 EMA. Thus, increasing the chances of high volatility in the days to come. Also, the alt reversed after the first retest of its trendline resistance, affirming the downtrend.
So, a sustained close below the $17-zone would be a crucial confluence to reaffirm the downtrend of the DOT. In which case, the alt eyed at a probable retest of the $14-mark in the days to come. A close watch on the 20 February candlestick would be vital to determine bullish revival possibility.
Rationale
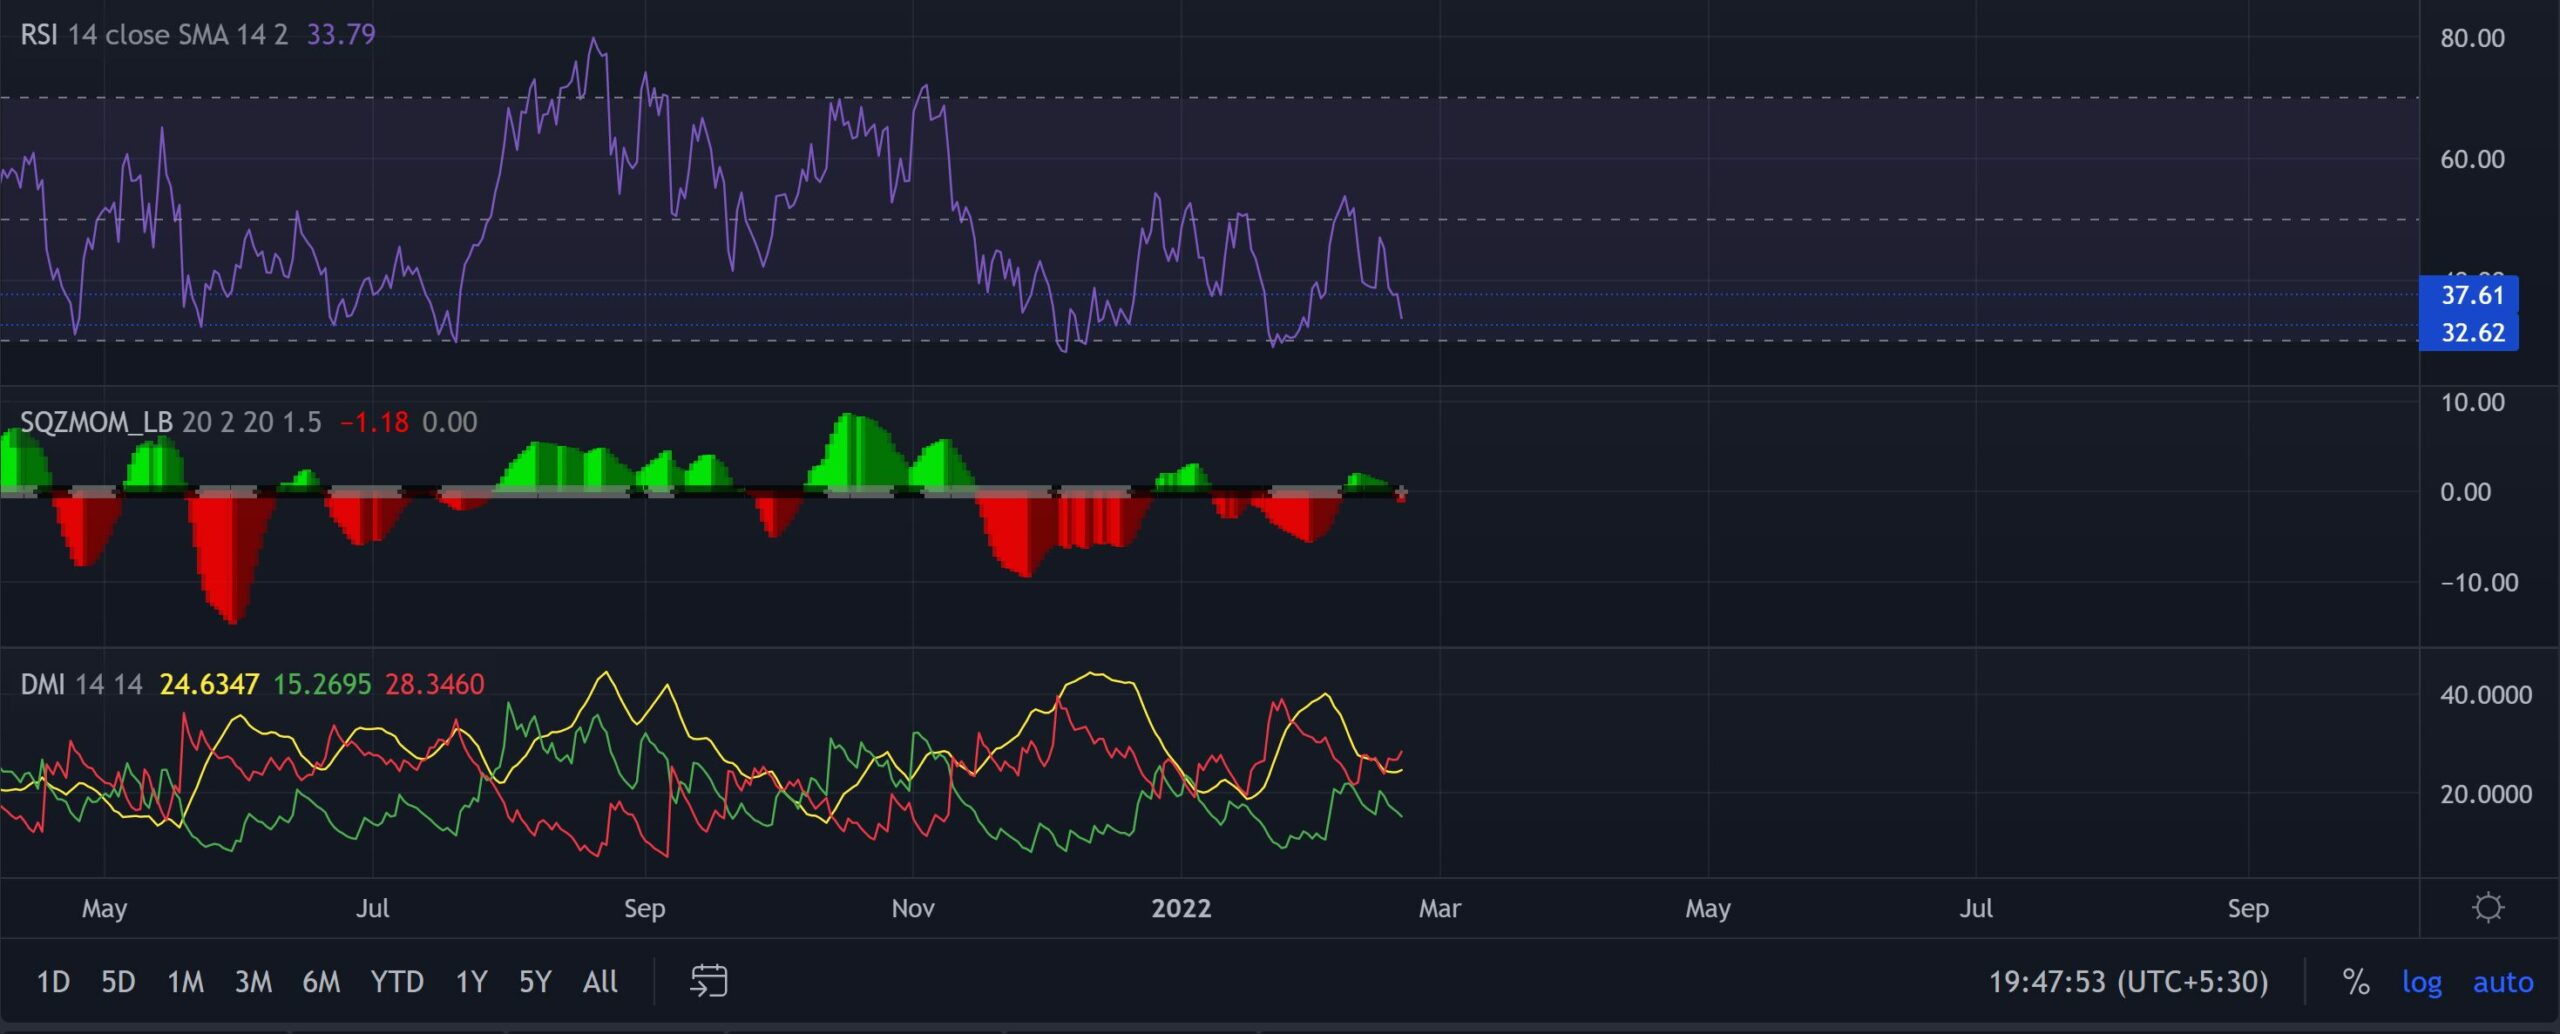
The RSI struggled to find a close above the midline since mid-November, confirming the bearish edge. Now, it looked south toward the 32-mark after losing the 37-point.
To top it up, the Squeeze Momentum Indicator displayed a grey dot on 20 February. This reading entailed a high volatility phase. Also, with the -DI looked north, DOT still refrained from revealing solid recovery signs.
Conclusion
DOT lost its vital 61.8% Fibonacci support that coincided with its six-month-long trendline resistance. Thus, affirming the strength of the current downtrend. Retracements below the Point of control would find a floor near the $14-mark before a trend committing move.
Even so, an overall market sentiment analysis becomes vital to complement the technical factors to make a profitable move.


