Chiliz finds support at $0.105 but another move downward remains likely

Disclaimer: The information presented does not constitute financial, investment, trading, or other types of advice and is solely the writer’s opinion
- Higher timeframe market structure was firmly bearish for Chiliz
- The 21-period moving average could prove pivotal once again
Chiliz has shed 62% in the span of 50 days. Football fever was raging around the start of the FIFA World Cup, but this only served to trigger massive sell orders. Even though Bitcoin and Ethereum have traded within a range over the past month, Chiliz has been in a vicious downtrend.
Are your CHZ holdings flashing green? Check the Profit Calculator
This highlighted the steady upper hand the sellers have enjoyed in recent weeks. Buyers can wait for a flip of the market structure to bullish alongside sustained demand before placing their bids.
December has seen multiple support levels broken and $0.105 could be next on the list
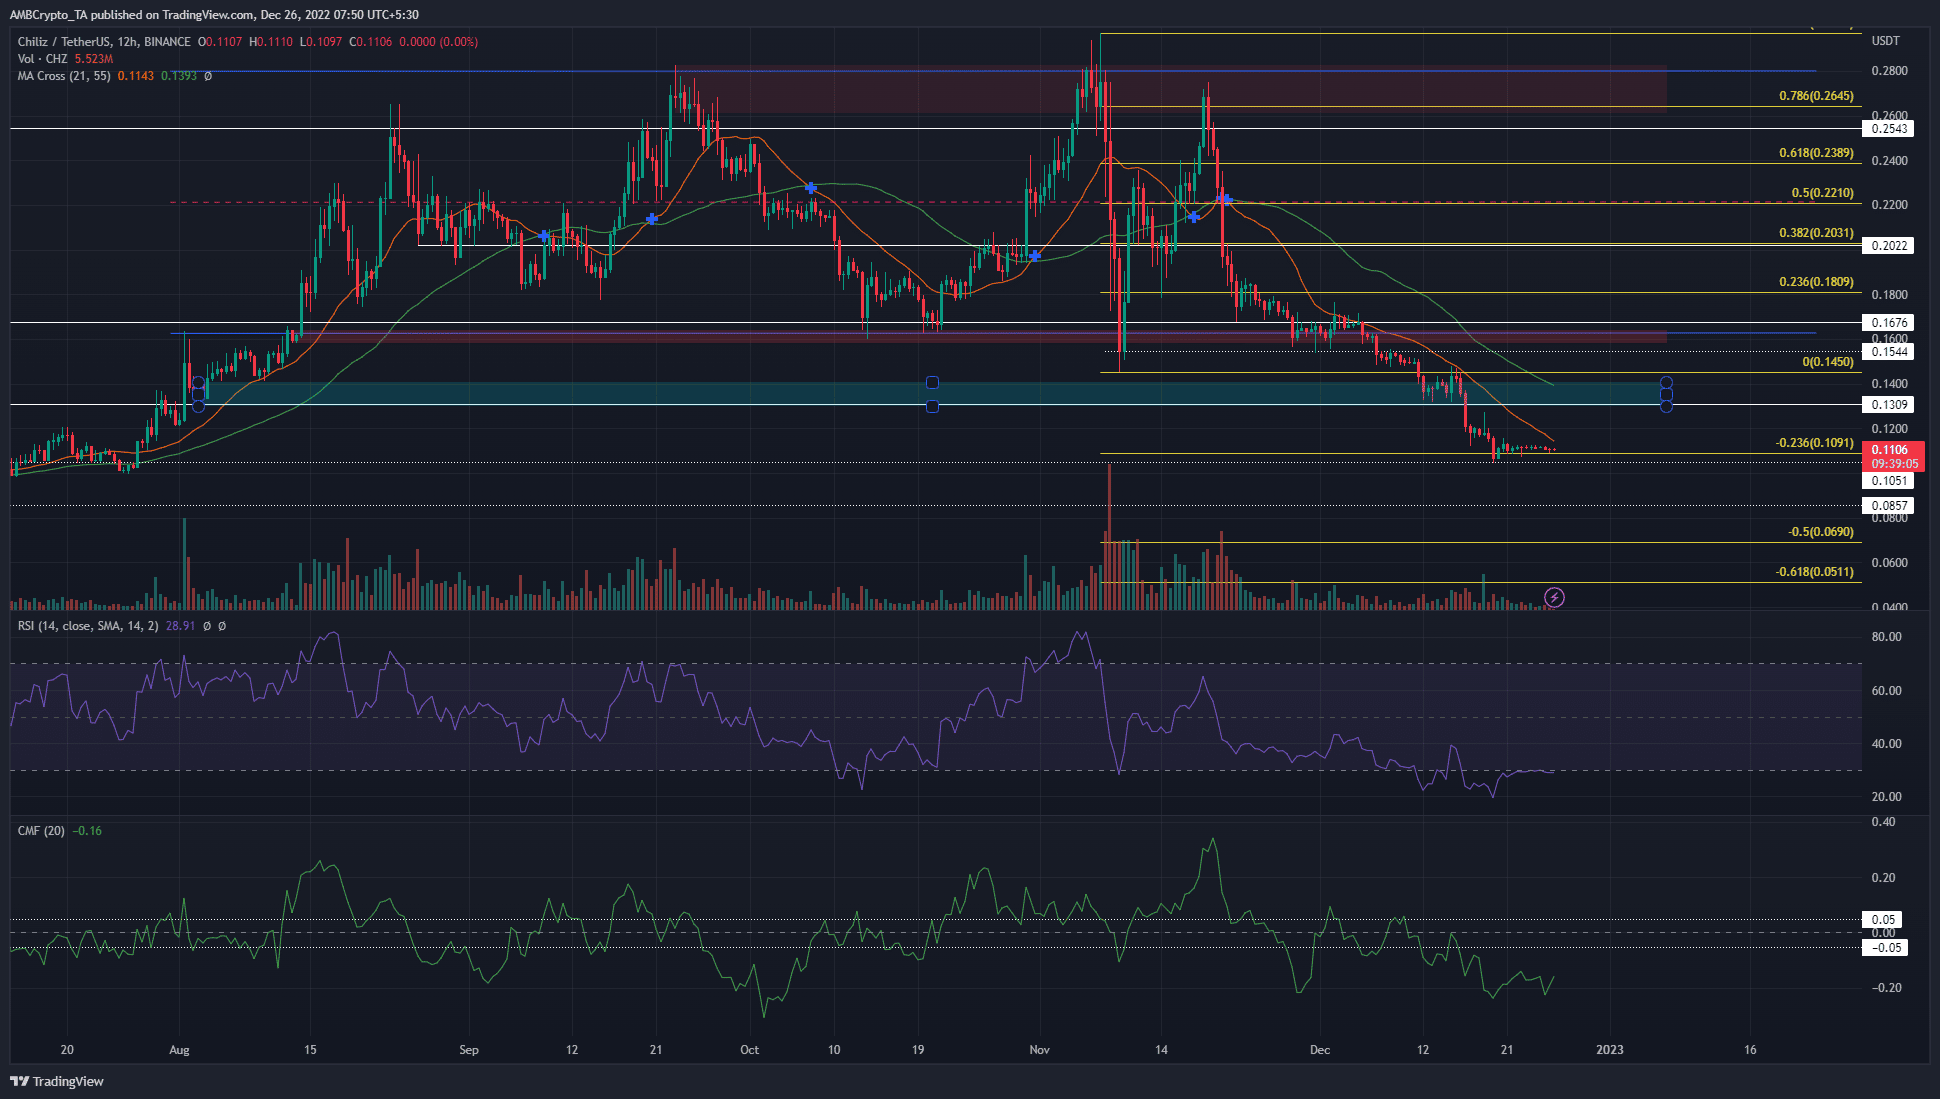
From mid-August to early December, Chiliz traded within a range that extended from $0.1635 to $0.28. When the lows of this range were broken and retested as resistance earlier this month, it showed that sellers were dominant in the market.
The Relative Strength Index (RSI) fell beneath neutral 50 on 20 November, and the 21 and 55-period moving averages formed a bearish crossover on 21 November. The Chaikin Money Flow (CMF) also saw a sharp decline around that time.
Together they highlighted the selling pressure CHZ faced in late November. At the time of writing as well, the RSI was at 28.9 to show oversold conditions. The CMF also showed significant capital flow out of the market.
The 23.6% Fibonacci extension level has acted as support in recent days, alongside the horizontal level at $0.105. The 21-period moving average (orange) has acted as resistance throughout December, and aggressive sellers can look to go short if CHZ tags the MA once more. They can target $0.085 and $0.069 as take-profit levels.
Does the spike in dormant circulation indicate another wave of selling?
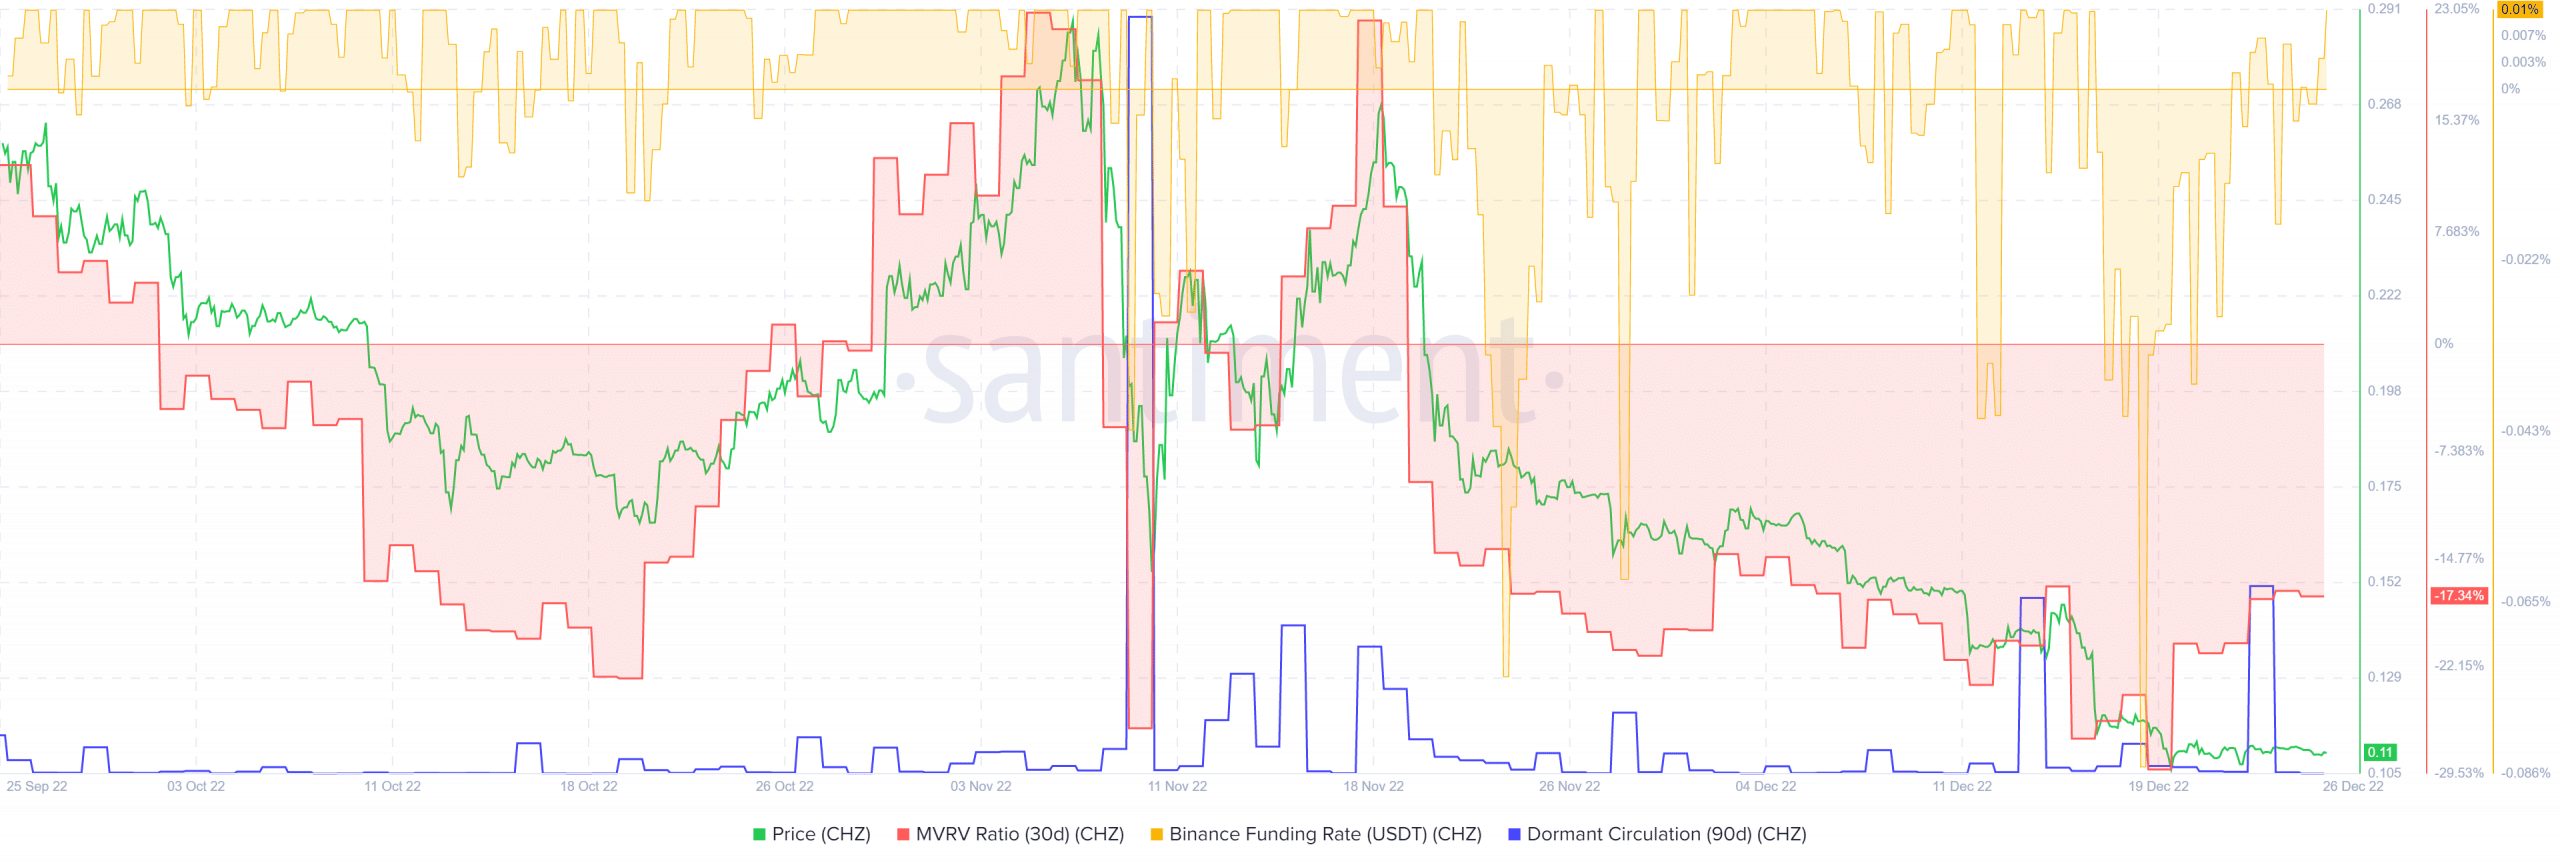
The 30-day Market Value to Realized Value (MVRV) ratio has been in the red since mid-November. This showed that the token was likely undervalued on the shorter time scales. Yet, that did not mean CHZ flashed a buy signal. Instead, it reinforced the strength of the downtrend.
How many CHZs can you get for $1?
With Bitcoin also showing weakness on the charts, investors can anticipate another move downward. Even though the funding rate was positive, the trend was certainly not bullish for CHZ, not even on lower timeframes such as H4 or H1.