Cosmos: Discussing ATOM’s potential to reach $16

Disclaimer: The findings of the following analysis are the sole opinions of the writer and should not be considered investment advice.
After attaining its all-time high (ATH) in January this year, Cosmos (ATOM)’s price came under fire as it succumbed to the market-wide selling pressure. In particular, April-June saw an unhindered bear run that pulled the coin toward its 20-month low.
While the recent price movements have marked gradual growth in the last three months, ATOM flipped the 200 EMA (green) from resistance to immediate support.
The coin currently stood at a vital juncture. A rebound from the confluence of support levels could aid the token in marking a near-term rally.
But the divergences along the indicators could pose hurdles. At press time, the alt traded at $14.4, up by 4.39% in the last 24 hours.
ATOM 4-hour Chart
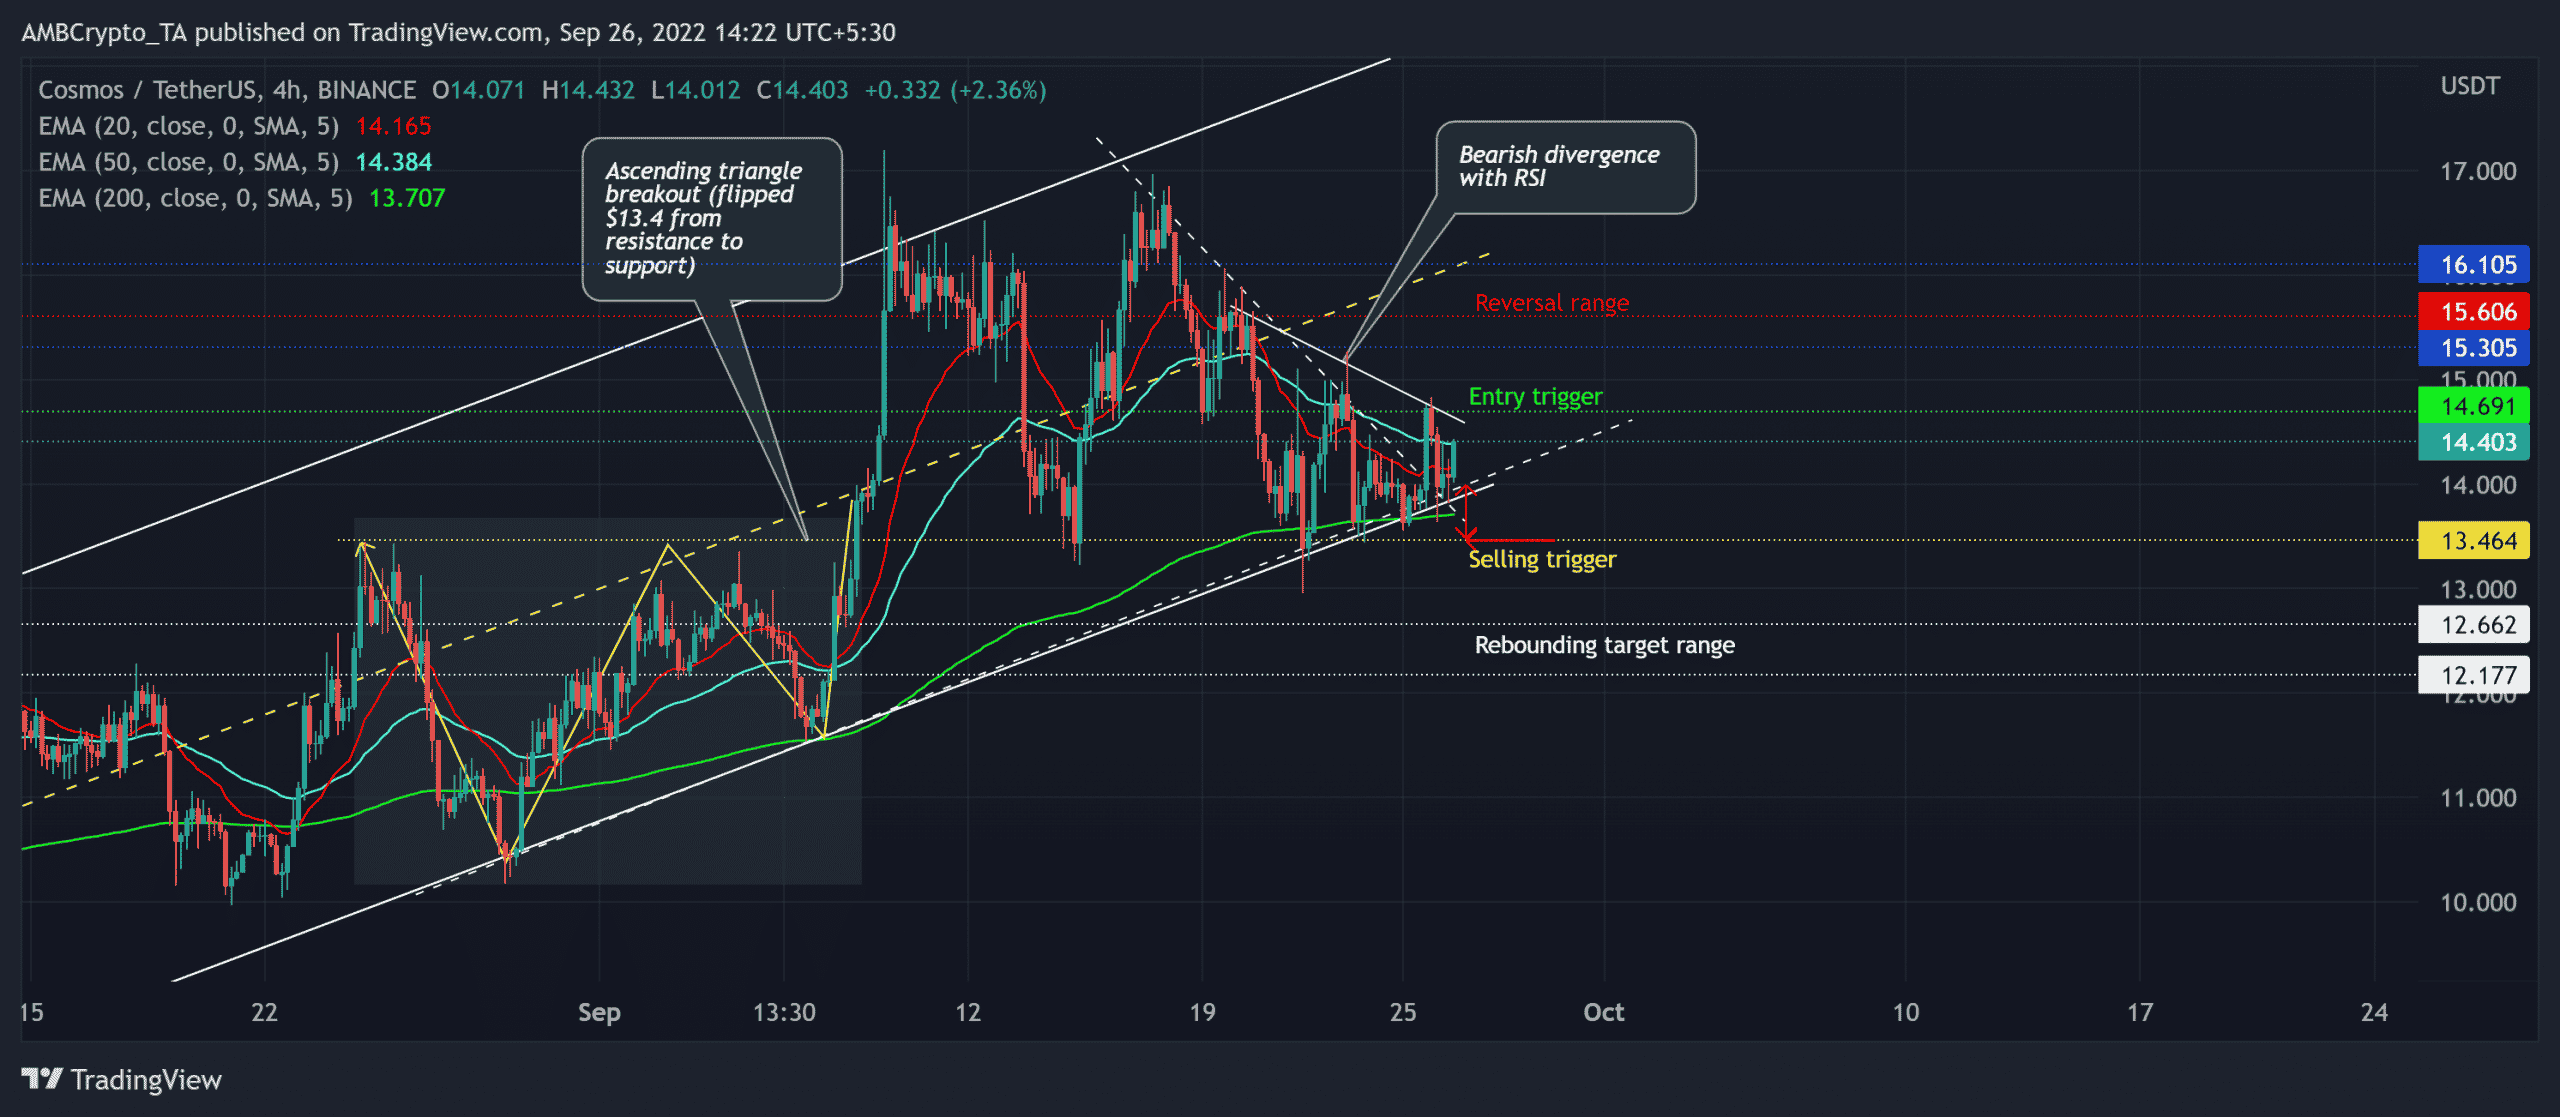
The rebound from ATOM’s 20-month low in June set the stage for a consistent recovery on the charts. These bullish efforts have aided the token in finding a spot above the 200 EMA. But the price was yet to fixate a solid position above the 20 EMA (red) and 50 EMA (cyan).
The recent ascending triangle breakout gave ATOM the much-needed push to flip the $13.4 level from resistance to support. Also, during the last two months, the price action has traced out an ascending channel (white).
With the price action bouncing back from the lower trendline of the up-channel and the 200 EMA support, it could find a bull rally provided it breaches the $14.6 resistance barrier. A close above this level would open buying opportunities with a target in the $15.3-$16 range.
Any bullish crossovers on the 20/50 EMA would affirm an increase in near-term buying strength. But an inability of the price to break above the 50 EMA and the $14.6 barrier would likely induce a slow-moving compressed phase on the charts.
A close below the up-channel and the $13.4 baseline would hint at a selling signal.
Rationale
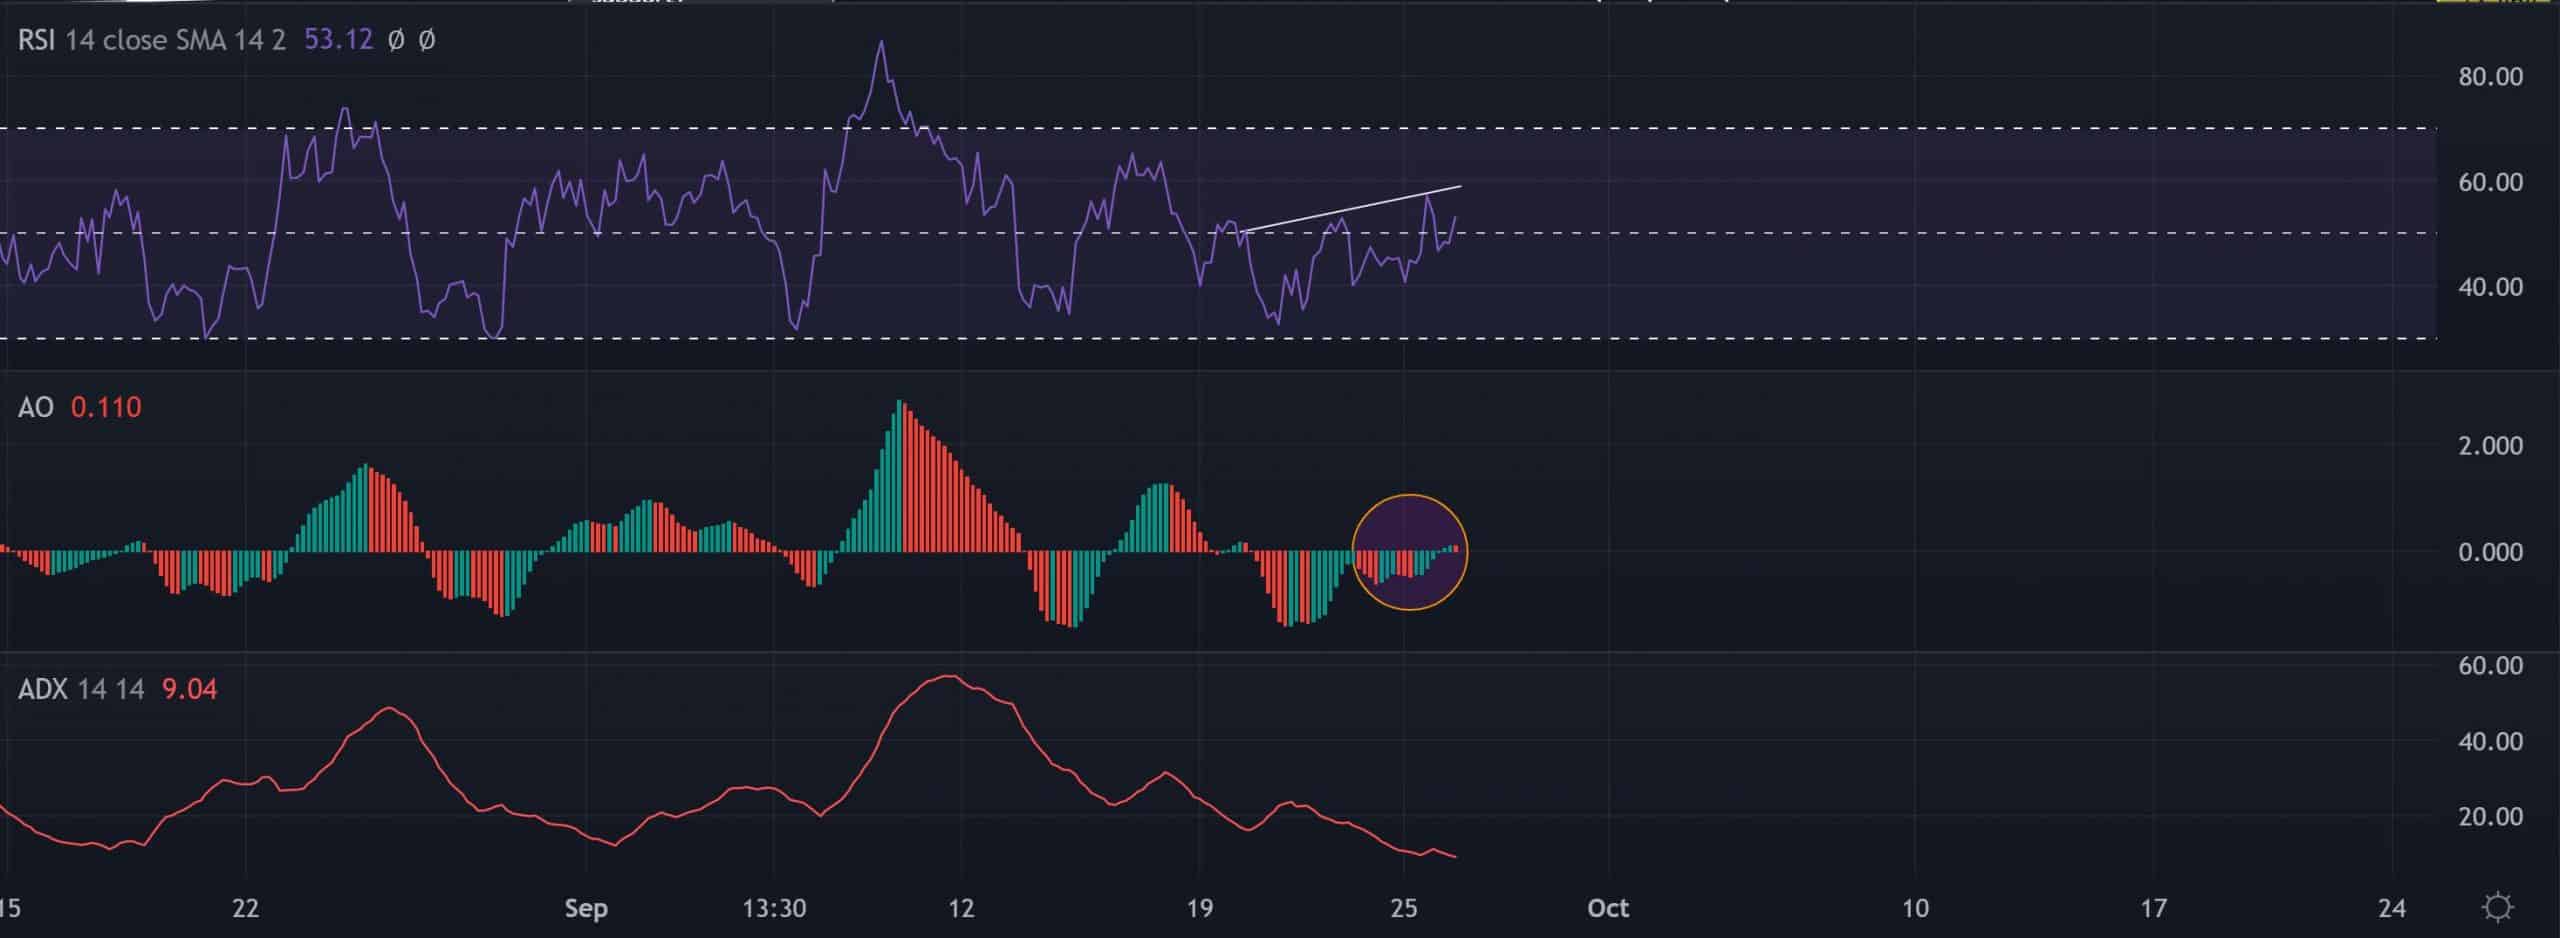
The Relative Strength Index (RSI) showed gradual recovery as it approached the midline from the oversold mark. But its lower peaks have bearishly diverged with the price action.
The Awesome Oscillator (AO) resonated with the ease in selling pressure as it closed above the zero mark. If the AO maintains its spot above this mark, it could present a buying opportunity. Nevertheless, the ADX displayed a fragile directional trend for ATOM.
Conclusion
Looking at the confluence of support levels (200 EMA, lower trendline of up-channel, $13.4 level), ATOM buyers would look for a convincing rebound. But the traders should look for entry triggers and targets discussed above to accommodate a bullish invalidation.
At last, market sentiment analysis to complement these technical factors is vital for making a profitable move.


