Cosmos: Tracing ATOM’s potential entry triggers after this pattern’s breakout

Disclaimer: The findings of the following analysis are the sole opinions of the writer and should not be considered investment advice.
- Cosmos [ATOM] witnessed a patterned breakdown and entered into its high liquidity zone.
- The altcoin’s social dominance and funding rates deteriorated over the last few days.
After dropping toward its yearly lows on 18 June, Cosmos [ATOM] bulls defied the broader bearish inclinations by inducing a streak of higher peaks toward its nine-month trendline resistance (white, dashed).
Here’s AMBCrypto’s price prediction for Cosmos [ATOM] for 2023-24
This bullish break transposed into a robust ascending channel on the daily timeframe. After an expected reversal from its long-term ceiling, ATOM swayed near the lower band of the Bollinger Bands (BB).
At press time, the alt was trading at $11.5, up by 3.88% in the last 24 hours.
ATOM broke down from its up-channel
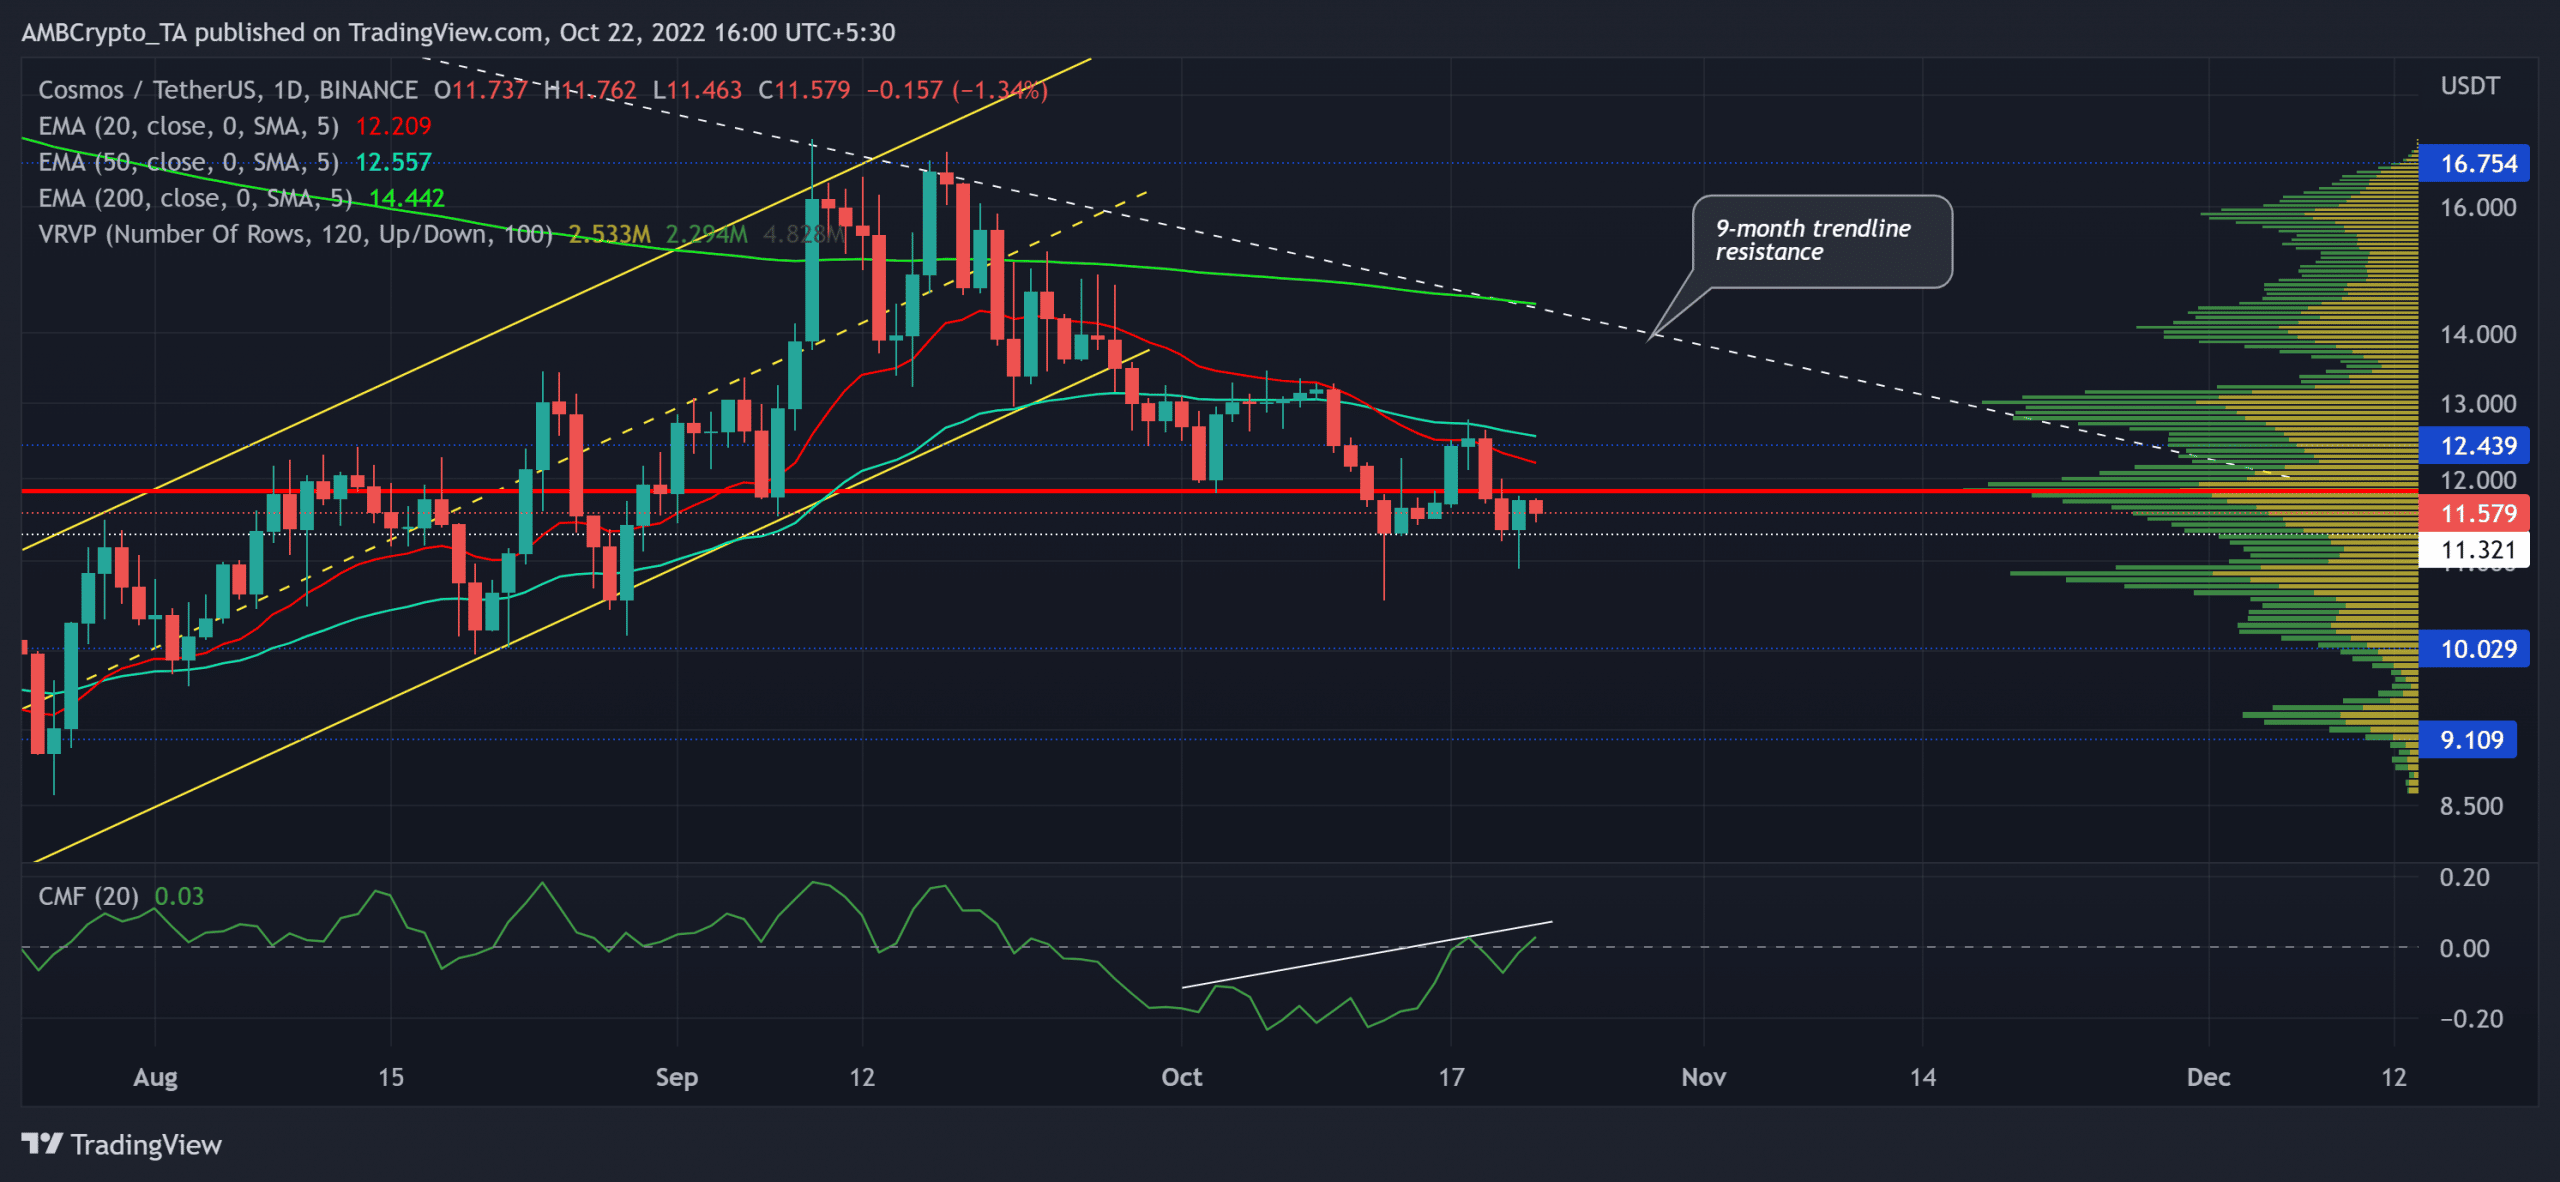
Despite the prevailing ‘extreme fear’ sentiment in the crypto market for the last few months, ATOM rebelled against the market-wide bearish inclinations to register consistent gains on its chart.
But the long-term ascending channel aggravated the selling pressure to induce a patterned breakdown. As a result, the price quickly dropped below the 20/50/200 EMA to exhibit a bearish advantage.
With the price action approaching the lower band of the BB near the $11.3-support, it could see near-term reversal provided it breaches the constraints of the 20 EMA. A close above this level would open buying opportunities with a target in the $14 range.
But the bearish crossover on the 20/50 EMA has reaffirmed the selling strength. An inability of the price to peak above the 20 EMA would likely induce a slow-moving compressed phase on the charts near the Point of Control (POC, red). A close below the up-channel and the $11.3 baseline would hint at a selling signal.
Furthermore, the Chaikin Money Flow (CMF) marked higher peaks as it bearishly diverged with the price action. But a consistent position above the zero mark could reveal an underlying increase in the bullish edge.
A decrease in social dominance and funding rates, is there a potential for reversal?
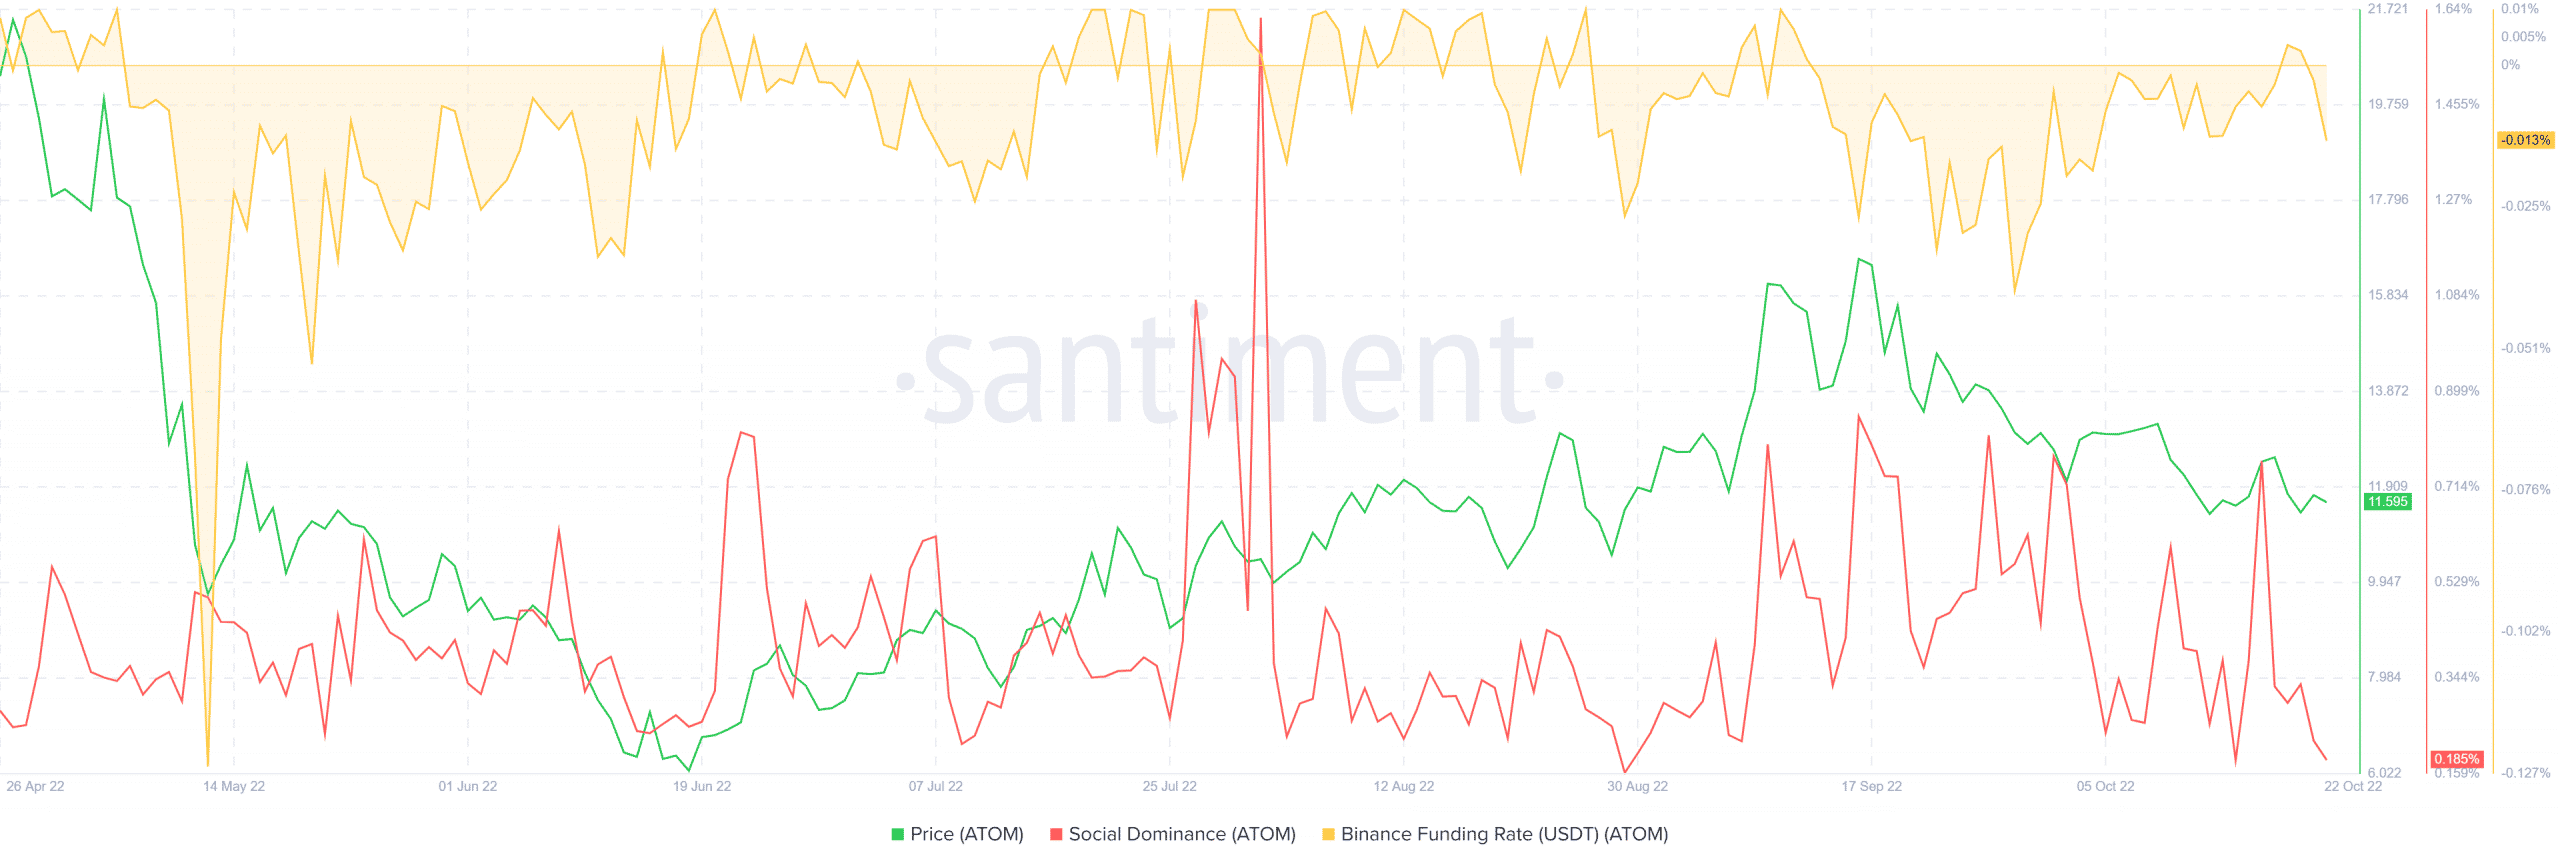
ATOM’s Binance funding rate turned negative over the last day. This metric implied that most traders have been slightly bearish in the Futures market.
Correspondingly, ATOM witnessed a dip in its price action. On the other hand, ATOM’s social dominance marked a substantial pullback over the last five days. A plausible rebound on this metric could aid the price in finding near-term gains in the coming days.
All in all, ATOM stood in a relatively high liquidity zone. The buying/selling triggers and targets would remain the same as discussed. Finally, buyers should factor in Bitcoin’s movement and its effects on the wider market to make a profitable move.