Cosmos: Why a revisit to this bearish trend could offer a selling opportunity

Disclaimer: The information presented does not constitute financial, investment, trading, or other types of advice and is solely the writer’s opinion.
- The daily timeframe was bearish
- A move above $13 looked unlikely and would give impetus to the bulls
Cosmos has been in a downtrend since late September. Therefore, traders looking to trade with the trend can look at the higher timeframe. On the short-term price charts, the past couple of days saw a bounce from the $11 level.
Here’s AMBCrypto’s Price Prediction for Cosmos [ATOM] for 2022-2023
In other news, 17 new projects were added to the Cosmos ecosystem. Could ATOM force a break in its bearish higher timeframe structure on the back of such recent positive news?
Short-sellers rub their hands in anticipation of a $12.5 revisit
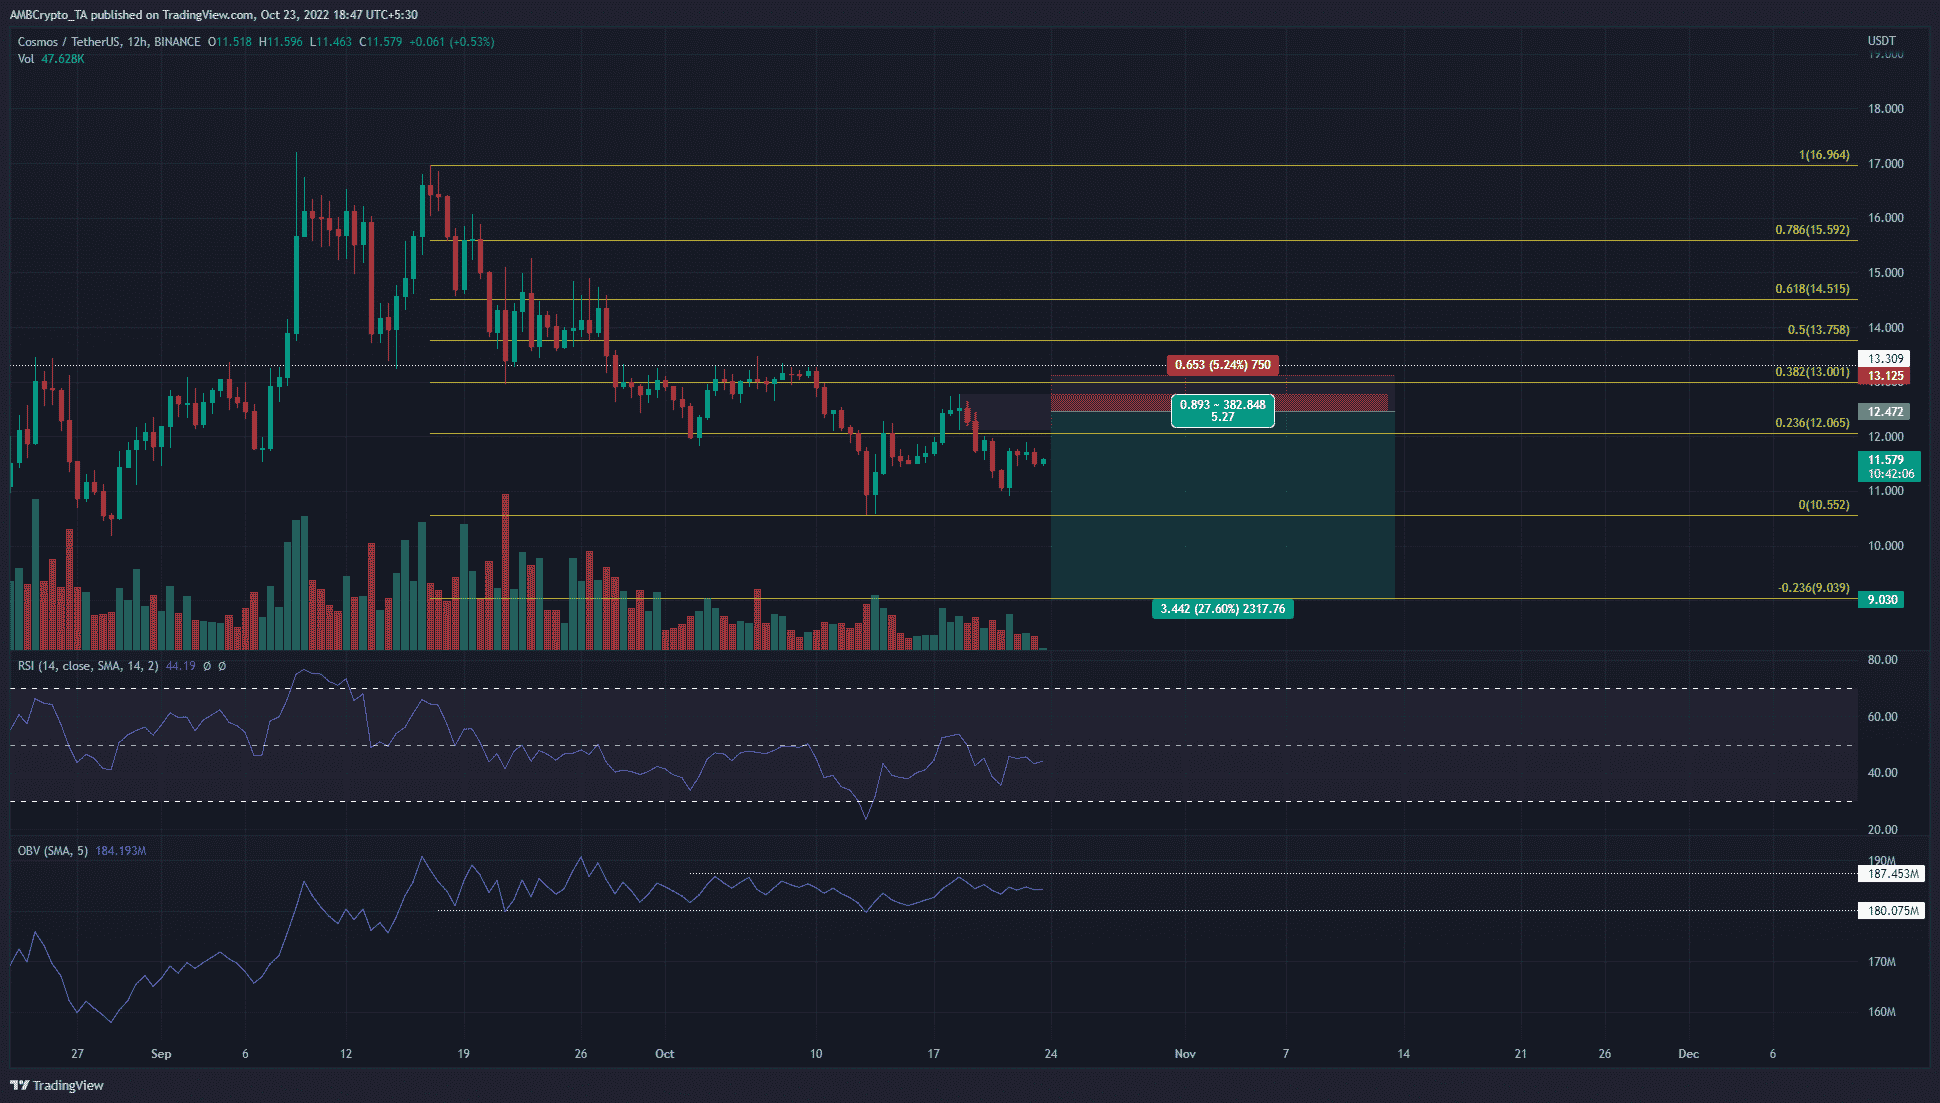
On the daily timeframe, the series of lower highs since mid-September meant the structure was bearish. The technical indicators also showed a neutral to bearish inclination. The Relative Strength Index (RSI) was beneath neutral 50 on the 12-hour chart, but it hasn’t dropped below 40 in the past week. This showed that momentum was not strongly bearish. The On-Balance Volume (OBV) also moved between two levels of support and resistance in the past month. A move past either level could pave the way for the next strong move as well.
The price action, as highlighted, favored the sellers on the daily and 12-hour timeframes. A set of Fibonacci retracement levels (yellow) showed the $13 mark to be the 38.2% retracement level. The 23.6% extension level lay at $9. A bearish order block was witnessed at the $12.6, near this $13 key level.
Hence, a short-term rally into this region over the coming days could be a trigger for short-sellers to seek selling opportunities.
Development activity lowered, social dominance unable to breach local highs
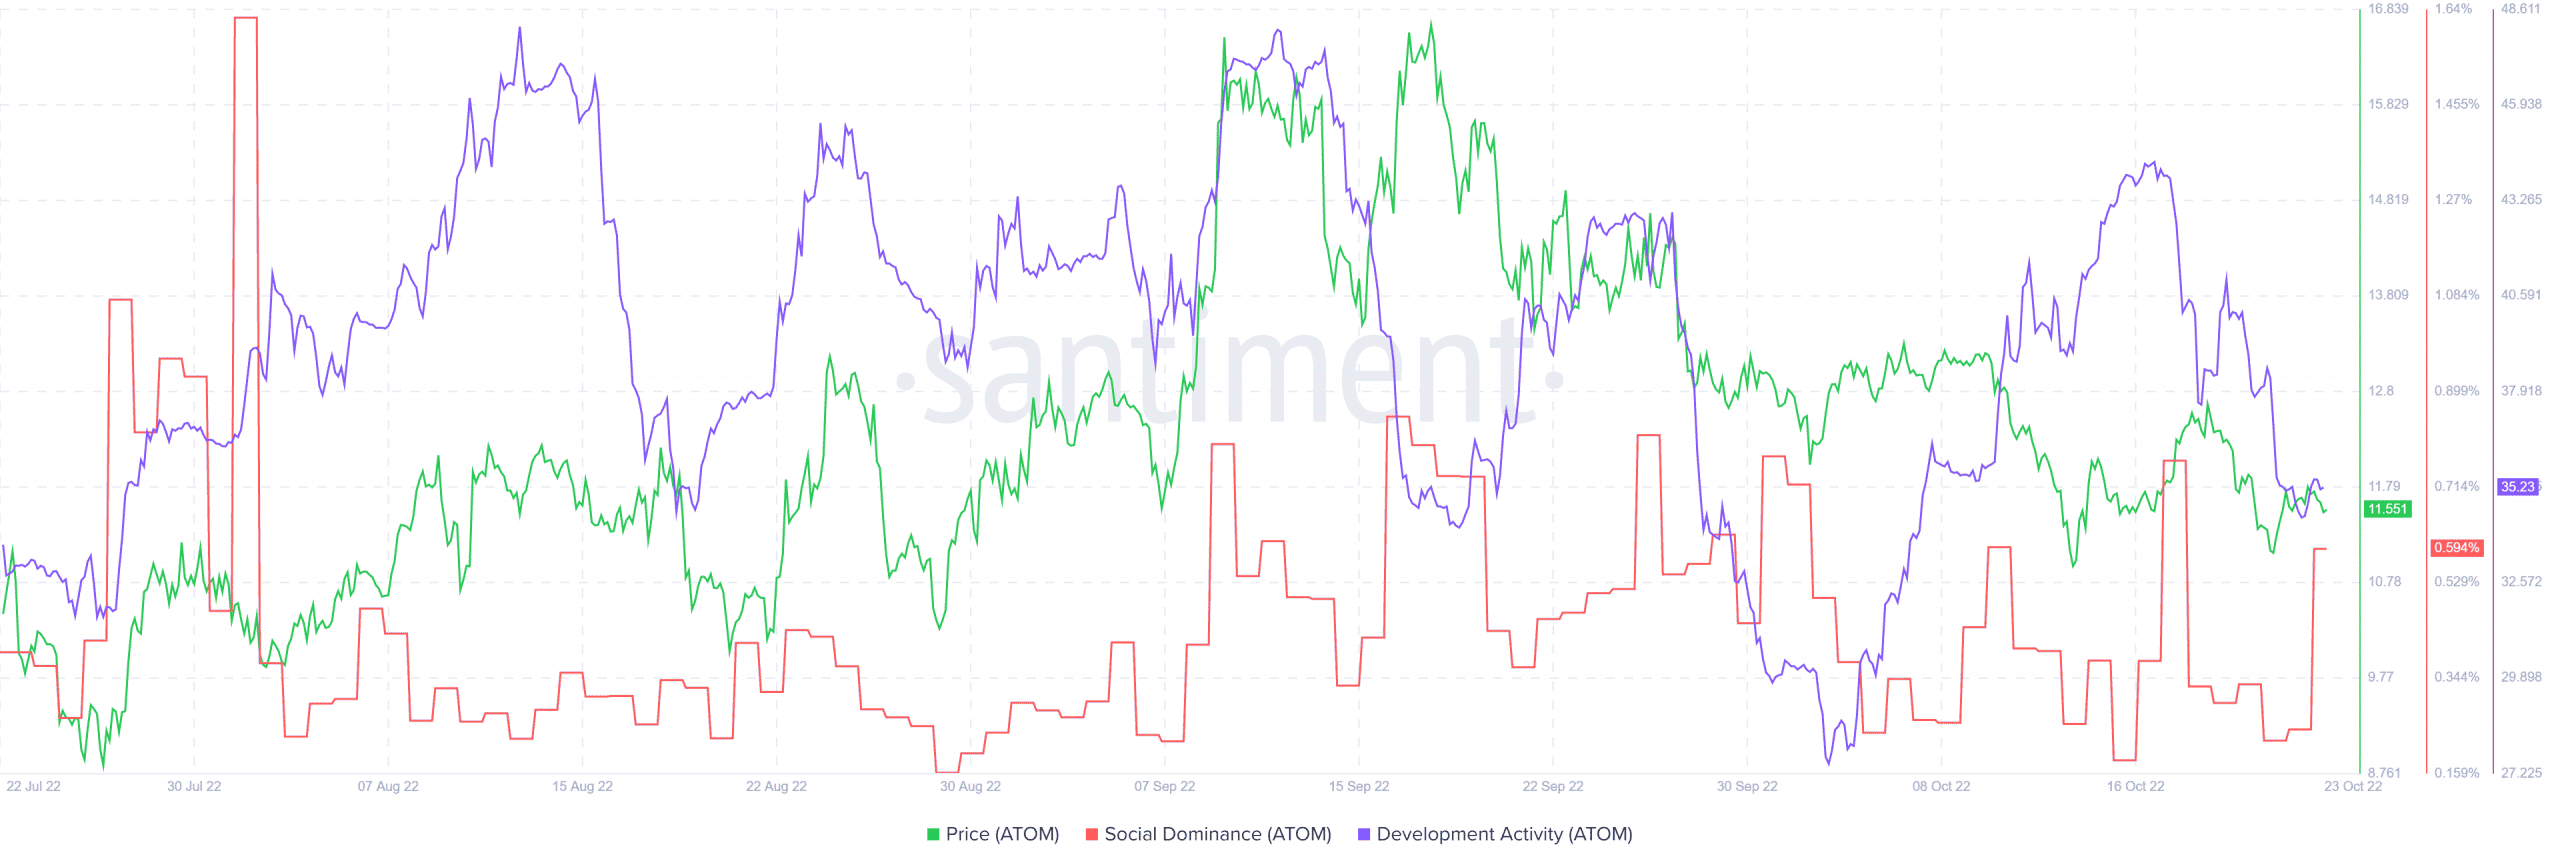
The development activity was strong in early to mid-October but it tailed off recently The social dominance metric also faced a ceiling at 0.72%. This was a roof that the metric had failed to break past even during the rally in early September from $11.7 to $16.7.
A revisit to the $12.6 area can be used to enter short positions. Invalidation of this idea would be a session close above the bearish order block. To the south, the $10.53 and $9 levels can be used to take profit by the bears.