Cosmos: Why traders shouldn’t miss out on this ‘ideal’ buy opportunity

Disclaimer: The findings of the following analysis are the sole opinions of the writer and should not be taken as investment advice
Cosmos found some momentum on the charts post 7 September’s flash crash. After hitting the $17-mark, its price soared by a 110% in just one week. The rally was held together by corrective phases which ensured a more organic rise rather than just a sporadic jump.
Now, with ATOM easing away from its ATH, the price can be expected to form a higher low and continue its upwards trajectory. The Fibonacci Extension tool can be used to determine a few targets going forward.
At the time of writing, ATOM was trading at $33.8, down by 3% over the last 24 hours.
ATOM 4-hour Chart
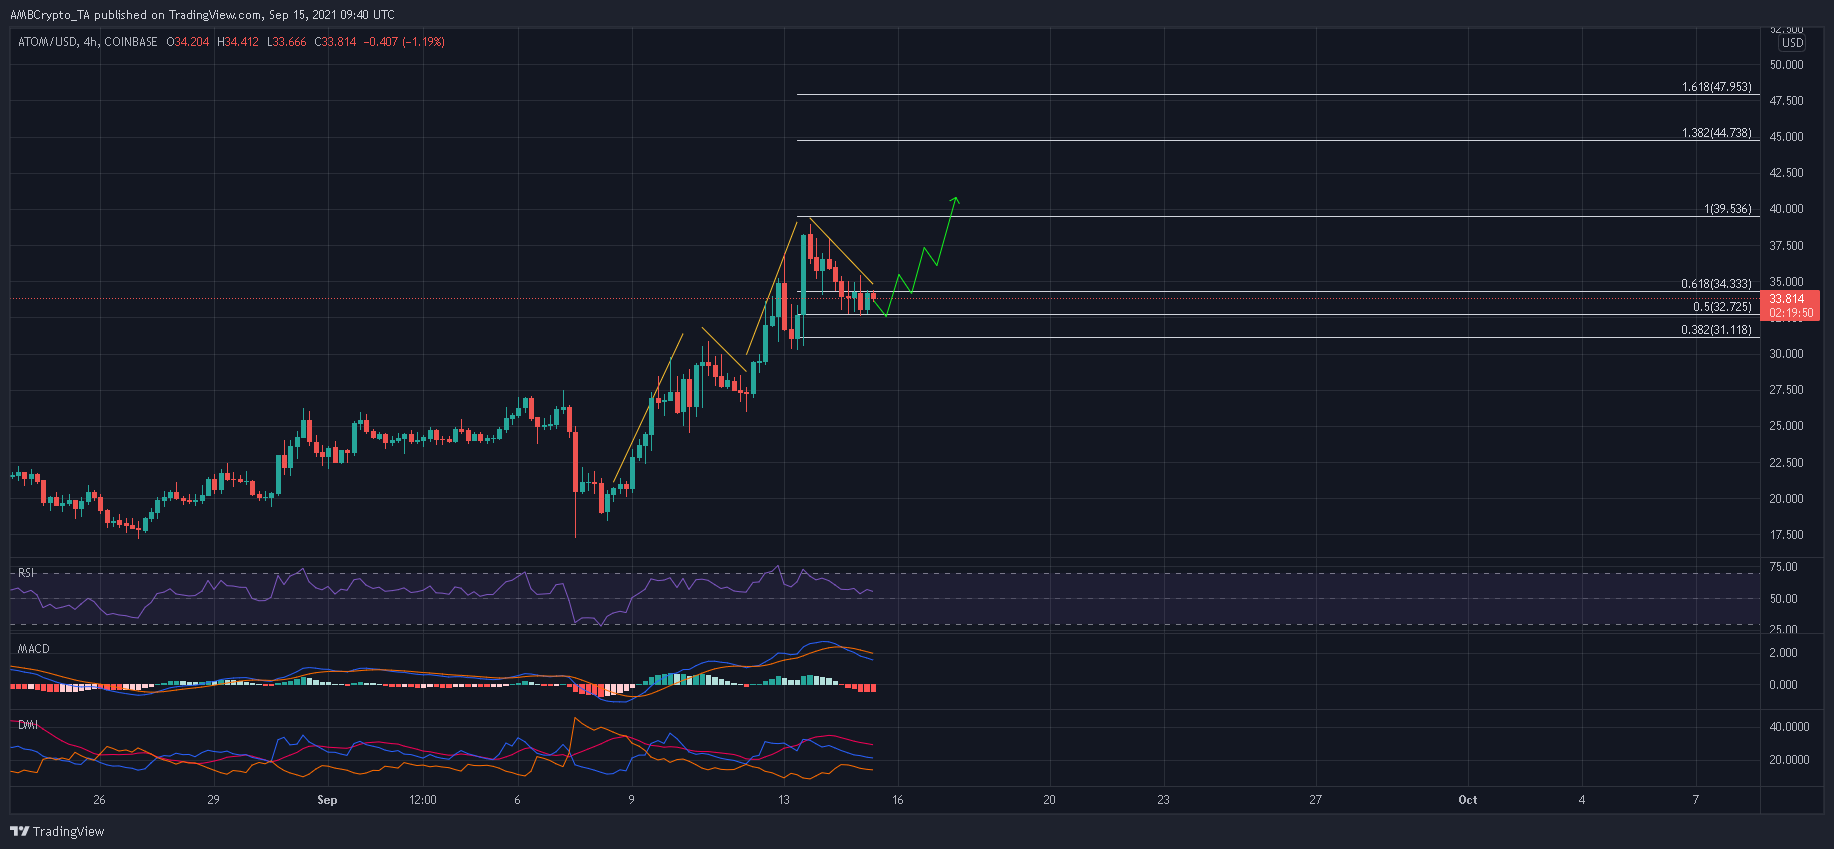
The upper sloping trendlines highlighted ATOM’s trajectory over the past week. Higher highs were formed at $27.5, $30.9, and at an ATH of $38.9. On the contrary, higher lows were snapped at $24.5 and $27.7. After the price hit its record high, a cooldown allowed ATOM to slip below the 61.8% Fibonacci Extension level.
From here, a higher low formed anywhere above the 38.2% Fibonacci level would allow ATOM to maintain its upcycle. In such a case, the next targets lay at the 100%, 138.2% and 161.8% Fibonacci Extension levels.
To invalidate this outlook, ATOM will need to close below its previous swing low of $30.3. This would also induce some short-selling, exposing the market to a sharper sell-off.
Reasoning
Despite a few bearish signals setting in on ATOM’s indicators, each of them held above key areas. For instance, the RSI maintained above 50 after dipping from overbought levels. In an uptrend, the RSI usually finds support between 50-45. Similarly, the MACD was still trading at a 5-day high despite a bearish crossover.
Meanwhile, the Directional Movement Index’s +DI inched closer to the -DI. And, while there were some chances of an unfavorable crossover, buyers can be expected to fight back over the coming sessions.
Conclusion
Since ATOM seemed to be in the process of snapping a newer low, traders had the opportunity to buy the alt at a discounted level. Ideally, buy orders can be placed at the 50% Fibonacci Extension which functioned as support. When the price climbs above the 100% Fibonacci Extension level on the next leg upwards, traders will bag gains of over 20%.