Could this be the beginning of an extended recovery for Ethereum

As predicted in the previous article, ETH continued its upturn and toppled its long-term liquidity range (Point of Control/POC) and the 200 EMA (green) over the past two days.
Now, ETH aimed at a possible test of its POC before continuing its upturn. As the price crossed its 200 EMA, the bulls would now continue to mount up buying pressure to snap the $3,300 mark resistance in the days to come. At press time, ETH traded at $3,337.8, up by 6.5% in the last 24 hours.
ETH Daily Chart

Since losing its liquidity range at the $3,100-mark, the king alt saw major sell-offs on high volumes. Thus, ETH poked its six-month low on 24 January.
After obliging to its historical tendencies, ETH picked itself up from the 13-month trendline support. (yellow, dashed). After testing this level multiple times, the bulls finally propelled a strong rally in the last two weeks. Consequently, the alt saw an expected falling wedge (yellow) breakout on its daily chart.
During this recovery, the alt saw an over 34.3% ROI in the last 14 days while forming a rising wedge (white, reversal pattern). As a result, the price approached the upper band of the Bollinger bands (BB). Thus, from here, a likely near-term setback should not surprise the investors/traders. Following this, it would likely continue its uptrend as it broke above the POC and the 200 EMA.
Rationale
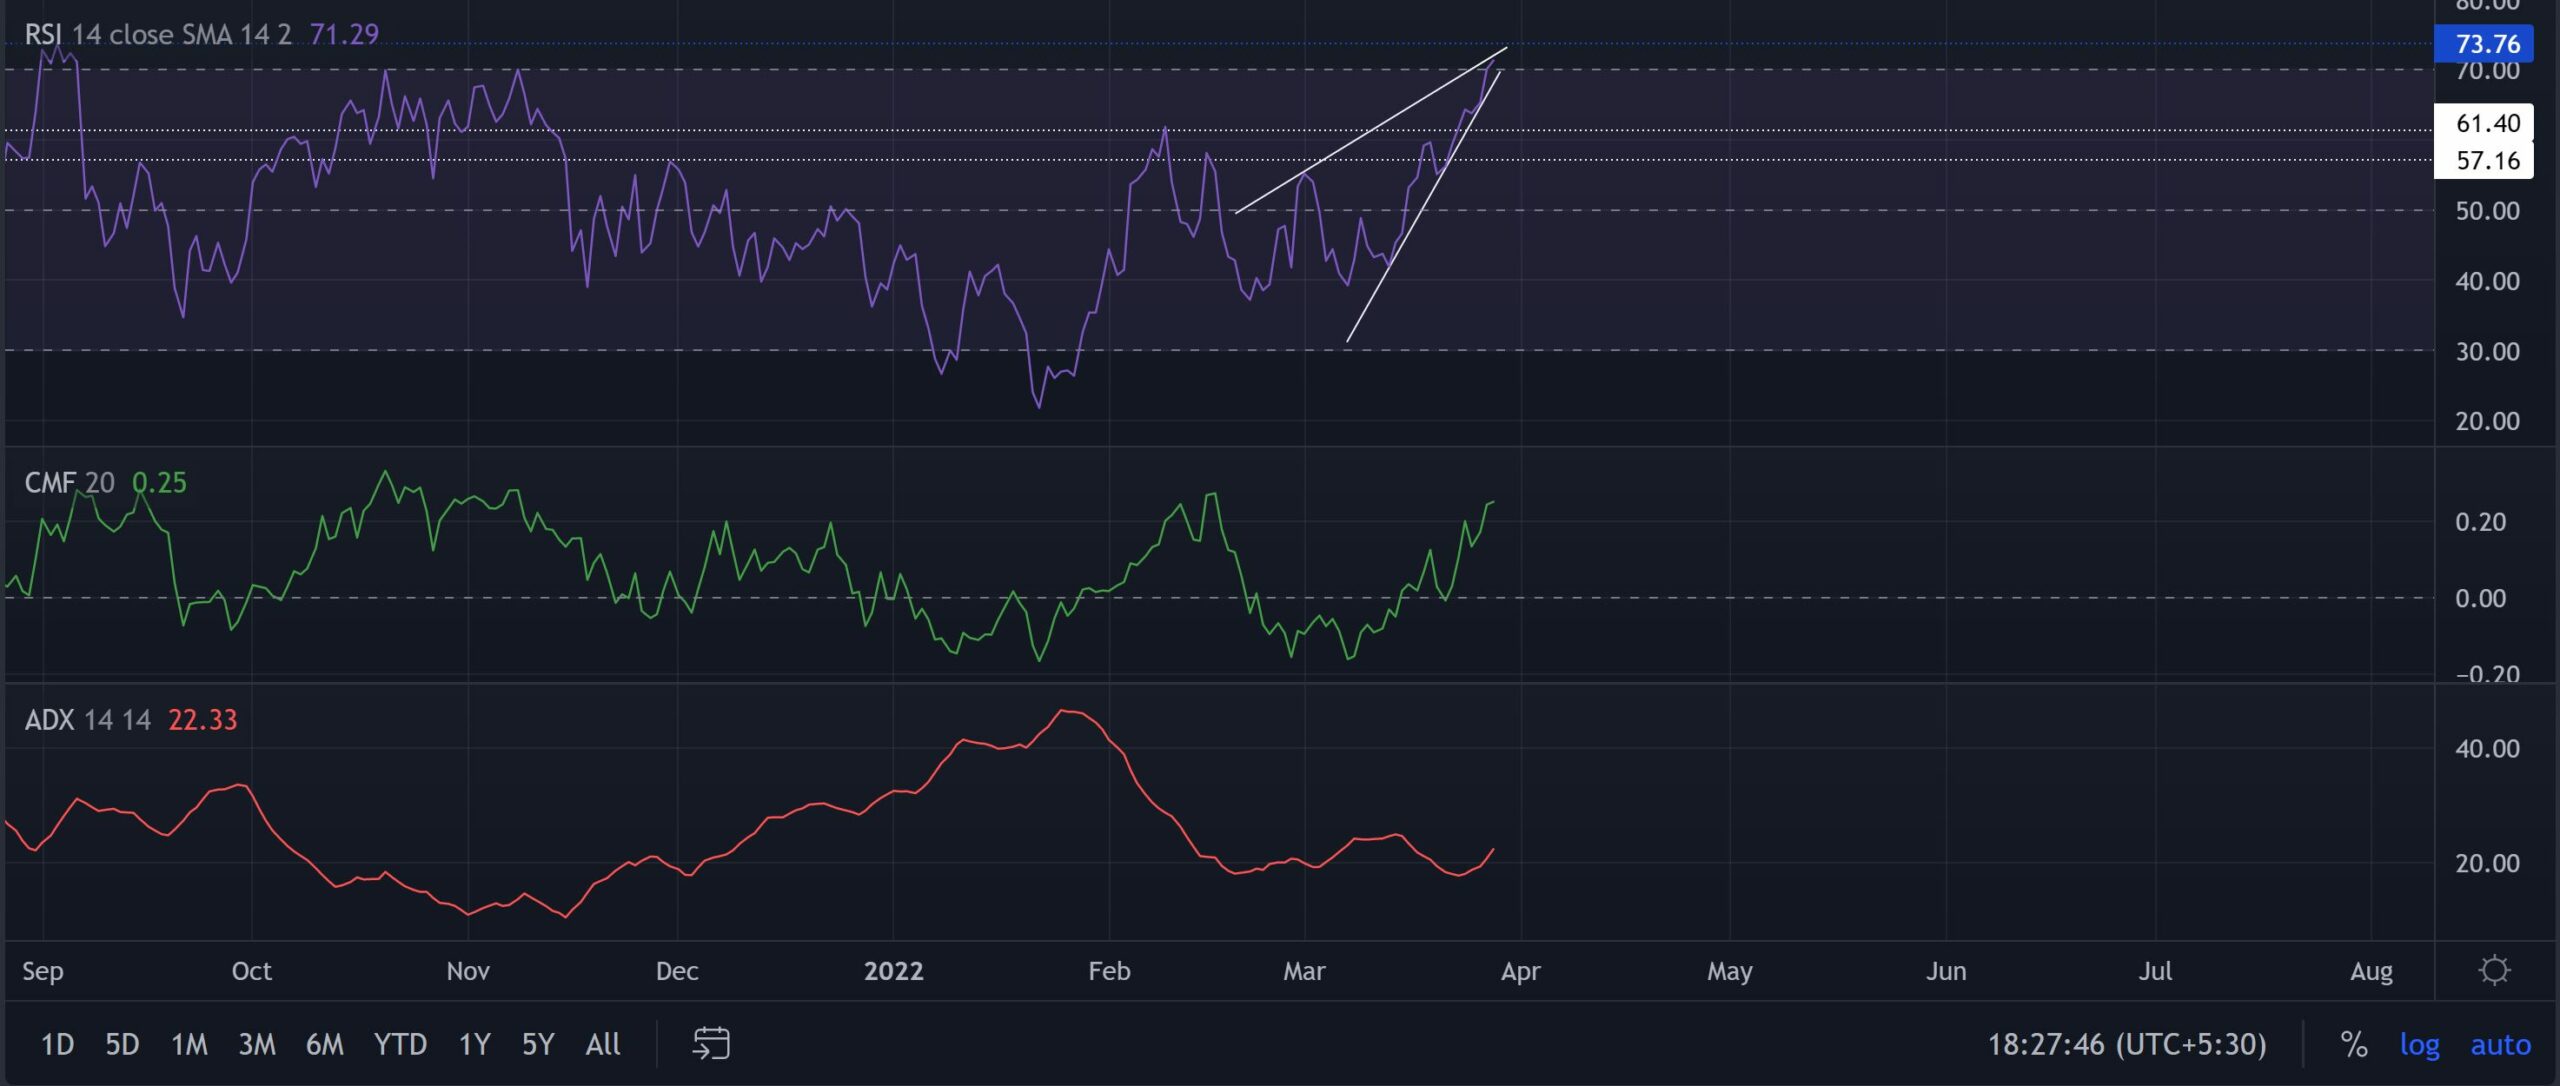
The RSI corresponded with the price for the most part while marking growth in a rising wedge. Since it entered the overbought region, a potential fall from here could trigger a patterned breakdown and thus lead to a test of the 57-61 support range.
Also, the CMF reaffirmed the increasing money flows into the crypto as it managed to keep a foothold above the zero-line. However, the ADX displayed a slightly weak directional trend for ETH.
Conclusion
Considering the overbought readings on the RSI and BB with the rising wedge pattern, A short-term setback could find a cushion near its POC. With the 20 EMA crossing the 50 EMA, the bulls took on the driving seat and would now try to overturn the $3,300-resistance.
Besides, investors/traders need to closely watch out for Bitcoin’s movement as ETH shares an astounding 96% 30-day correlation with the king coin.