Crypto.com coin, Tron, Kusama Price Analysis: 28 March

Crypto.com coin could move deeper into red territory if it fails to hold on to $0.2 support. Tron witnessed an upward breakout from a down channel, while Kusama maintained a strong uptrend since the start of 2021.
Crypto.com Coin [CRO]
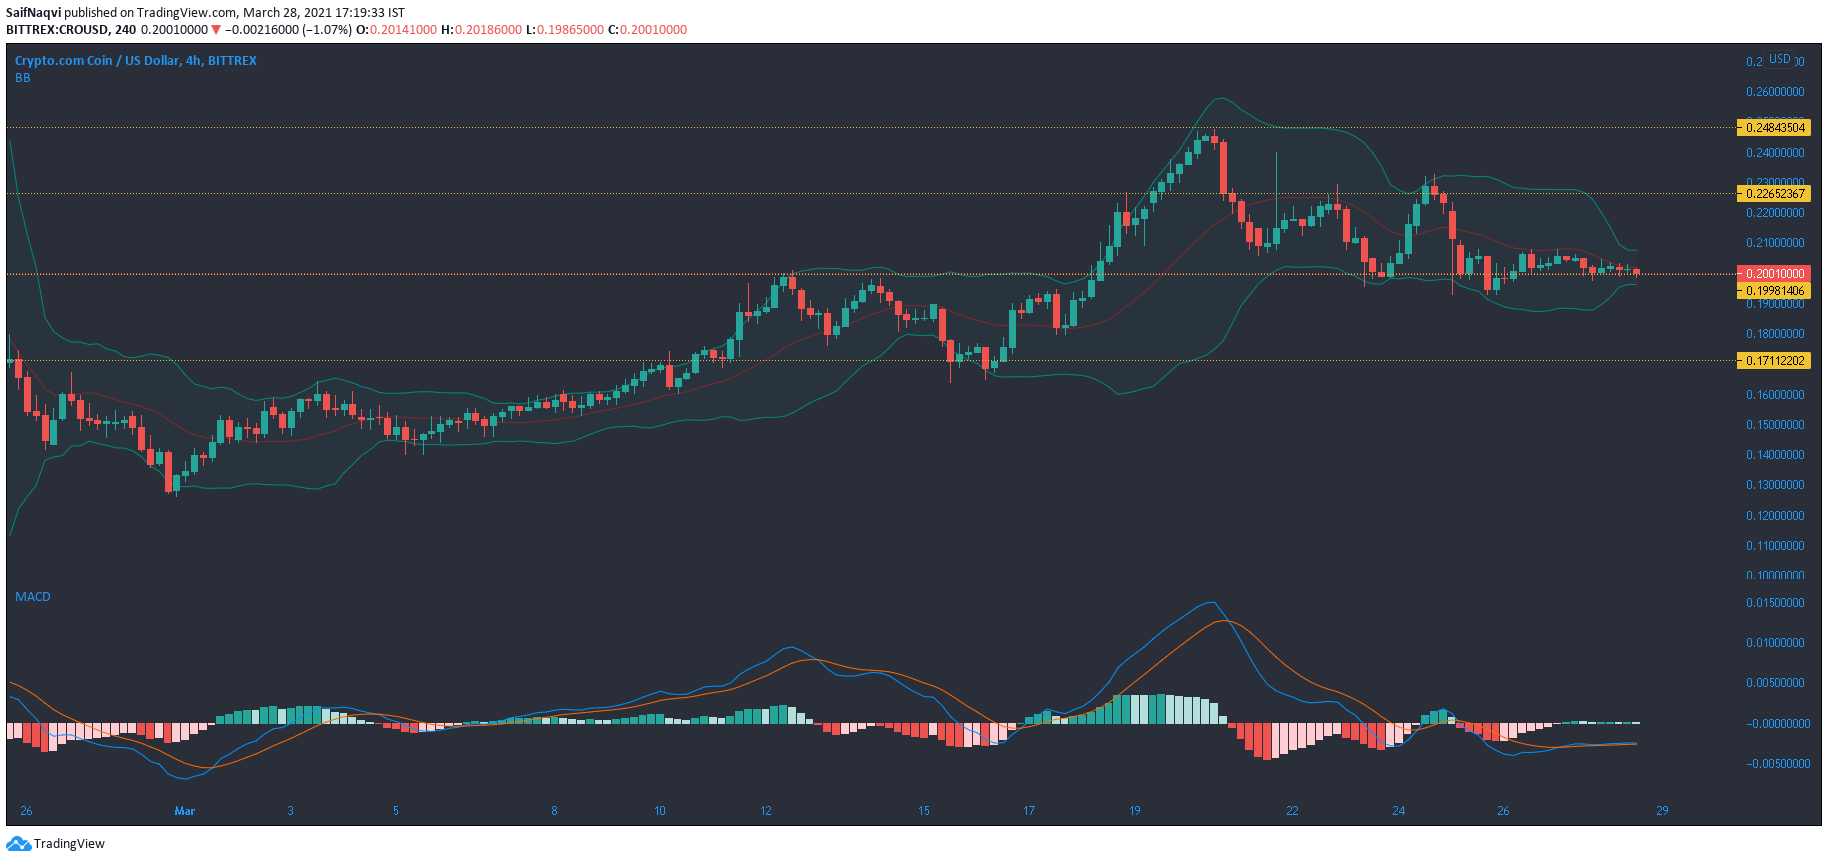
Bollinger Bands on Crypto.com Coin converged and showed low volatility in the market as the price moved slightly above $0.2. The aforementioned level represented crucial support for the bulls, and failure to maintain it would likely lead to additional losses towards $0.17, another strong region of support.
At the time of writing, the 24-hour trading volumes ticked up and a bearish scenario could be averted over the coming sessions. MACD line was superimposed on the Signal line and represented a balanced market. To target record levels, CRO bulls would look to initiate a rise above $0.248.
Tron [TRX]
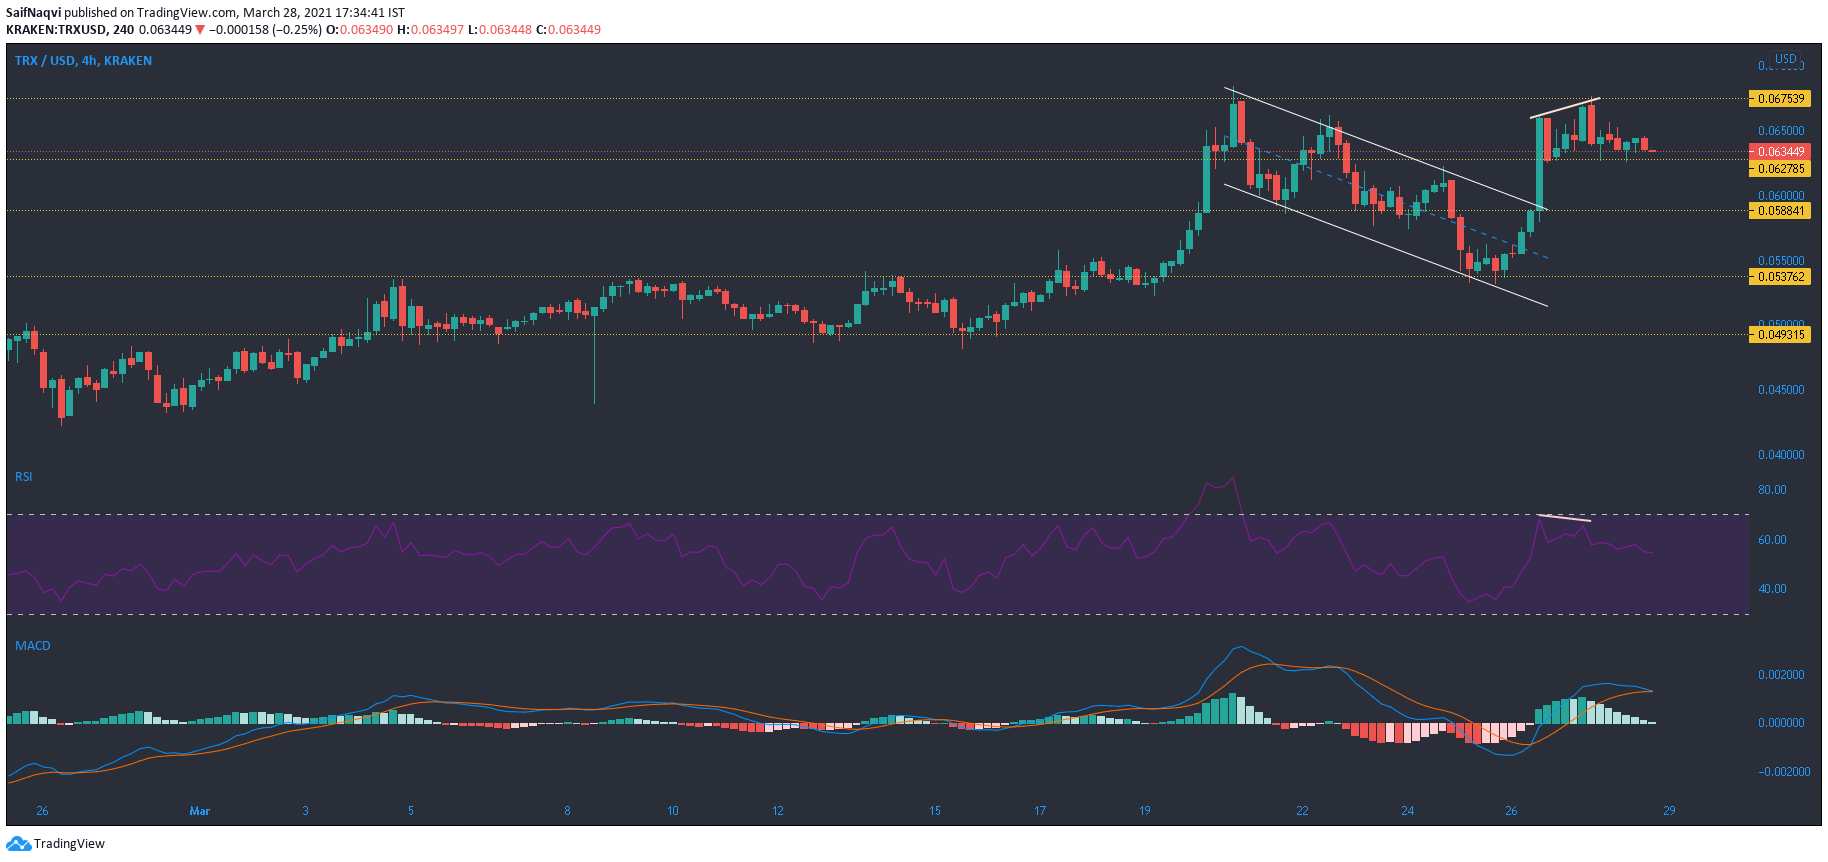
A breakout from the upper trendline saw sharp bullish movement on Tron as it negated a down channel on the 4-hour timeframe. The rise also saw Tron move towards its local high of $0.068, a region that witnessed a strong sell-off during the previous rally. With MACD closing in on a bearish crossover, and RSI showing a bearish divergence, the price was in danger of losing out to support at $0.0627.
If the bulls do overcome bearish sentiment and maintain the aforementioned support mark, then a rise above its local high would be on the cards. A boost from the broader market would also enable Tron to break upward on the chart.
Kusama [KSM]

A markup phase was evident on Kusama’s 4-hour chart after the price showed a prolonger uptrend since the start to 2021. Year-to-date gains amounted to over 568% as KSM climbed up the crypto-rankings and positioned itself as the world’s 25th largest cryptocurrency with a market cap of $4.1 Billion. Higher highs and fresher record levels were characteristics of a markup phase, and KSM’s price movement showed exactly that over the last few sessions of trade.
RSI pointed north from above 60 and showed strength on the bullish side. However, Awesome Oscillator noted some choppy movement and even registered a red bar at the time of writing. A pullback, although unlikely, would highlight support levels at $458.7 and $420.5.