Uniswap, Theta, Litecoin Price Analysis: 28 March

Uniswap moved sideways after failing to flip its overhead resistance at $29.3. Theta was projected to rise above $13.62-resistance on the back of bullish indicators. Lastly, Litecoin would likely lose out on $183.8-support if bearishness persists in its market.
Uniswap [UNI]
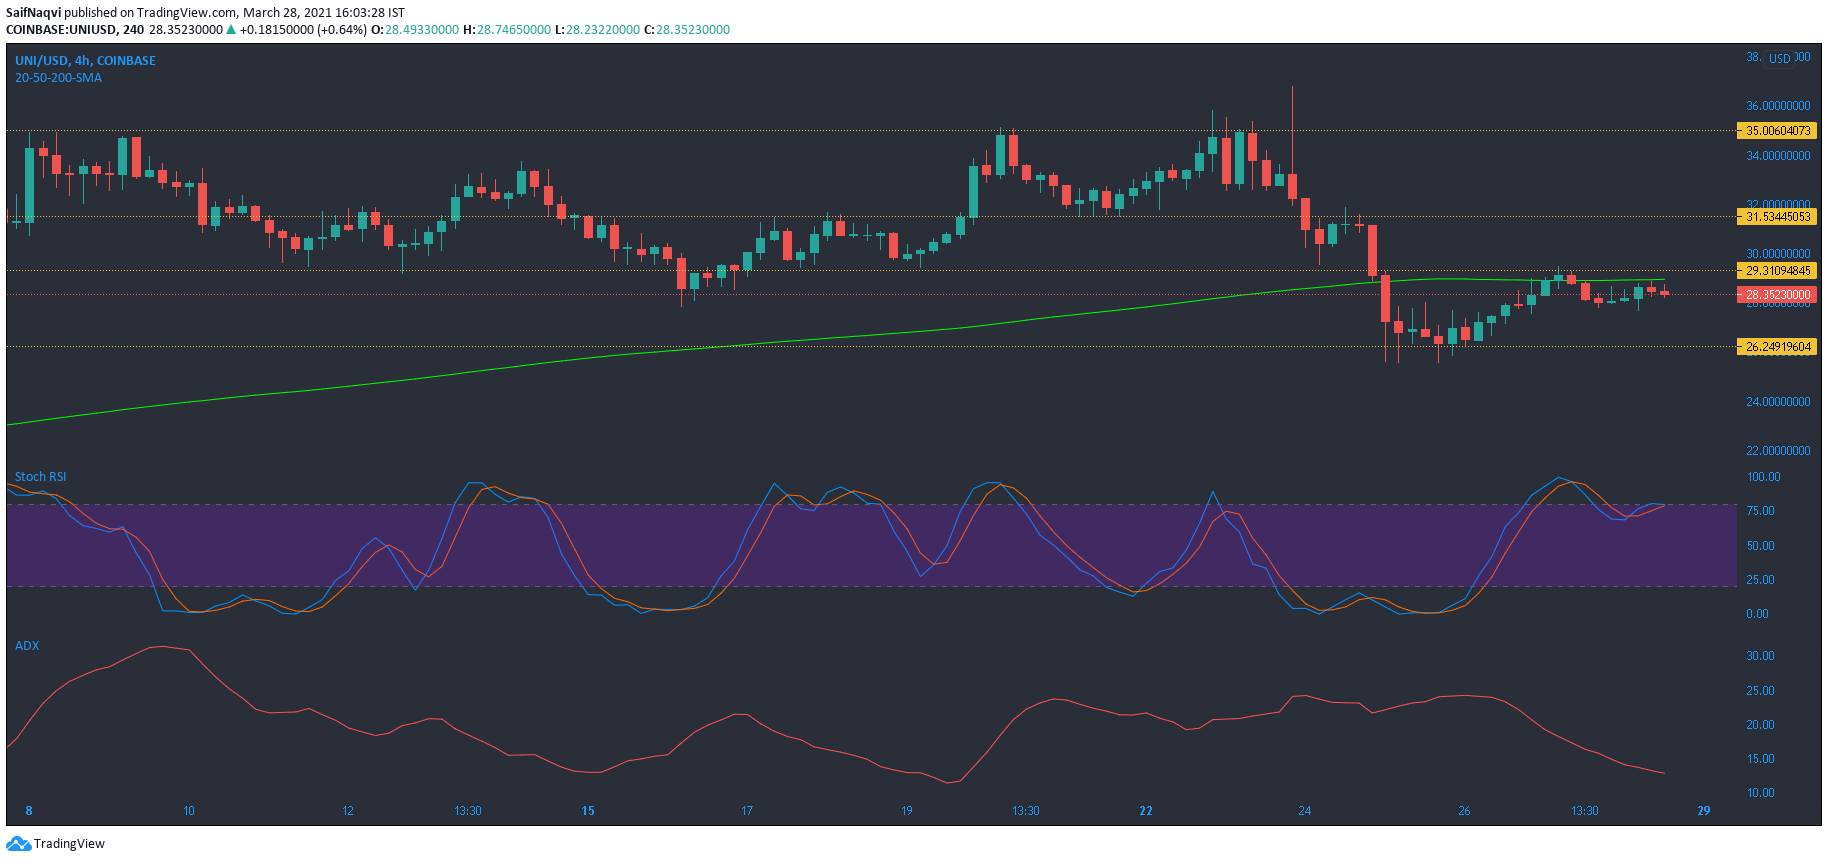
Some sideways movement was noted in Uniswap after the price failed to flip $29.3-resistance. Stochastic RSI reversed from the upper region as the price approached the aforementioned upper ceiling. This led to bearish price action over the last 24-hours. Further bearish sentiment came from the fact that the candlesticks traded below their 200-SMA (green).
With the ADX pointing south from 13, gains in UNI market were likely to be subdued over the coming sessions. The region above $31.5 has generally seen some buying activity, and the bulls would look to target that level for a rise towards UNI’s ATH.
Theta [THETA]
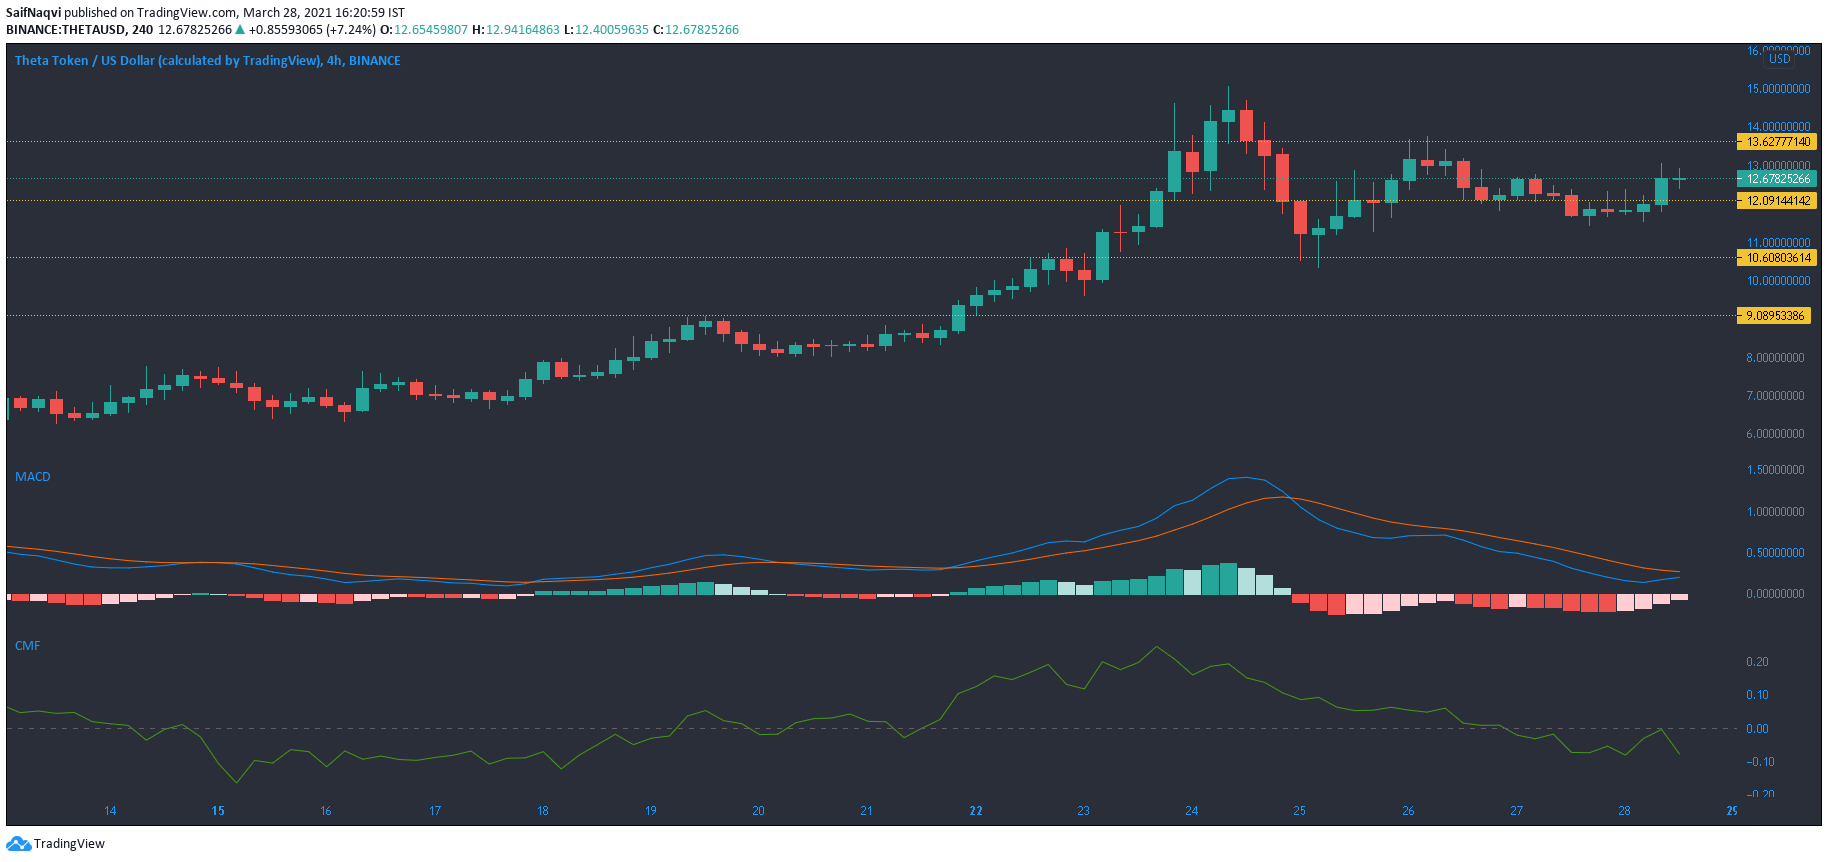
On the 4-hour timeframe, Theta showed bullish behavior as it recaptured the $12-mark. The newest addition to the top-10 ratings, THETA maintained its position as the world’s ninth-largest cryptocurrency with a market cap of$12.7 Billion. In fact, the price would be up for more gains as MACD line closed in on the Signal line. A successful crossover could see the price rise above its overhead resistance of $13.62.
On the downside, Chaikin Money Flow highlighted strong capital outflows as the index moved below the half-line. Considering the mixed indicators, stronger signals were needed to back a rise toward THETA’s ATH, especially since the trading volumes were muted at the time of writing.
Litecoin [LTC]
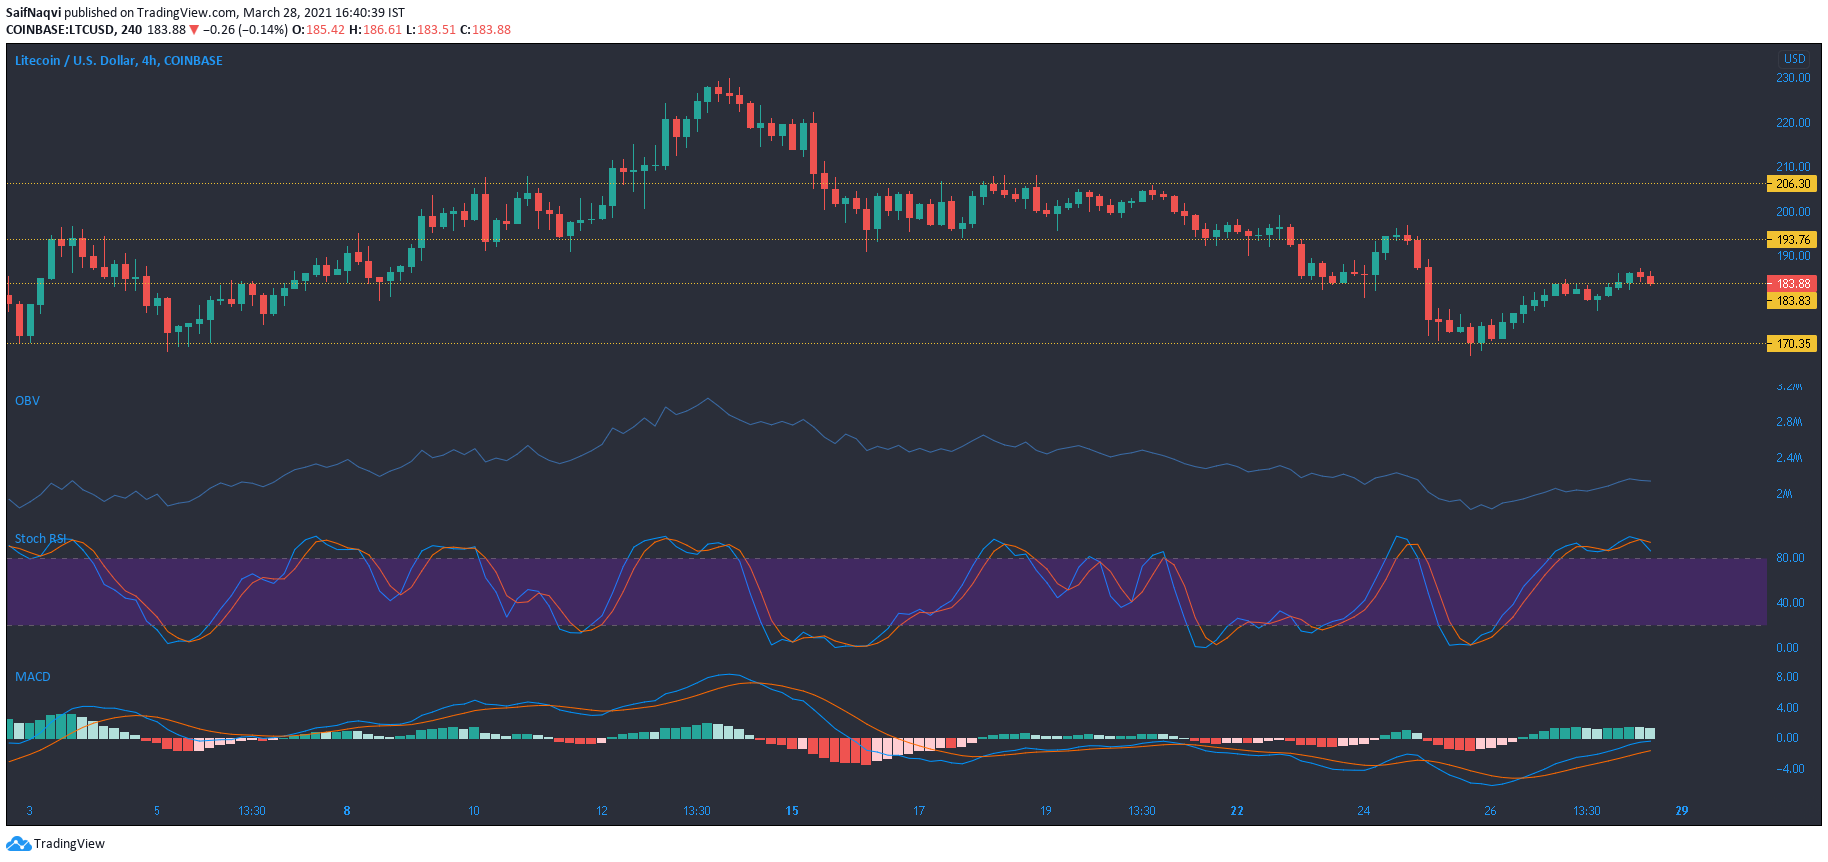
While Litecoin bounced back strongly and showed an uptrend from the $155-level, its recovery was halted as the price approached the $230-mark. A pullback soon followed as LTC dropped all the way down towards $170.3-support. Bullish movement was once again observed at the lower level, but the price stabilized just above $183.8-support at the time of writing.
Subdued trading volumes and minimal buying activity worked against a bullish short-term scenario. In fact, Stochastic RSI hinted at a reversal after a bearish crossover in the upper zone. MACD’s histogram also noted weakening momentum, even as the fast-moving line moved above the Signal line.