Decoding AAVE’s ride from $111 to $98 and its 24-hour tale

With price retracement underway in the cryptocurrency market, Bitcoin climbed above the $30,000 strategic price region during intraday trading on 6 June. The altcoin ecosystem was also impacted by these gains.
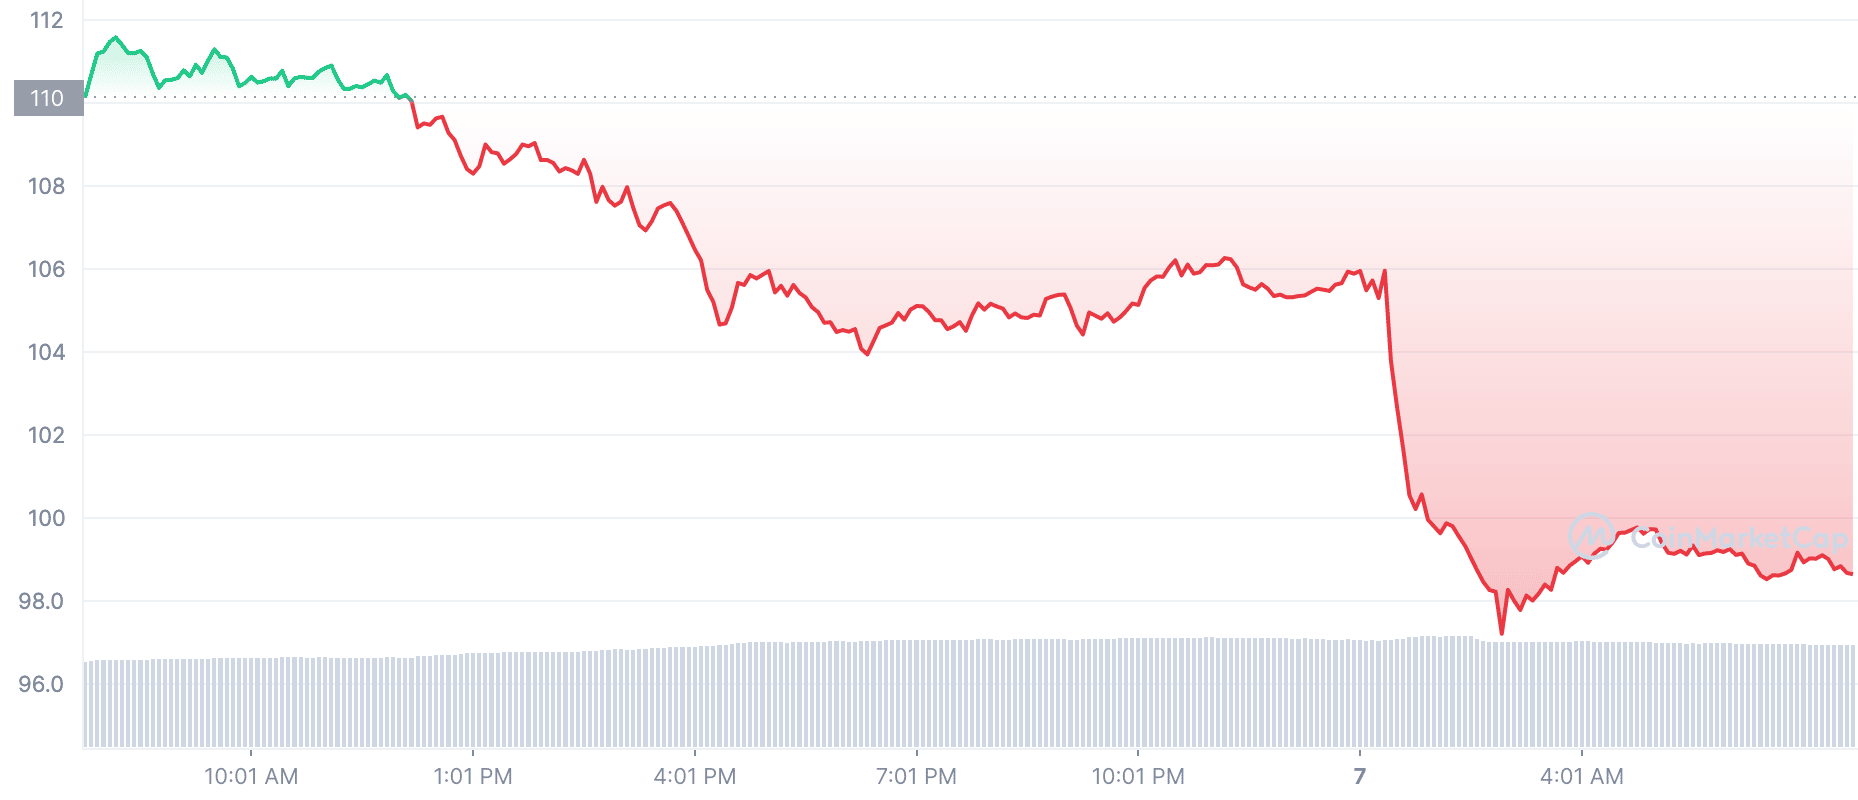
Interestingly, on Monday (6 June) the AAVE token broke past its crucial resistance level of $104 and proceeded to register a high of $111 during intraday trading.
However, this was immediately followed by a price retracement that caused the token to lose 10% of the accrued gains.
Exchanging hands at $98.63 at press time, what else did we notice in the last 24 hours?
Well, gains were merely…
At $98.63 at the time of writing, the AAVE token appeared to have shed all the gains it made during intraday trading on 6 June. With a 10.54% decline in price per AAVE token, a 20.16% increment was spotted in trading volume. Without a corresponding uptick in price, this is generally indicative of the increased distribution of the token.
Similarly, at $1.36b at press time, the AAVE token saw an 11% decline in market capitalization in the last 24 hours.
At the time of writing, the Relative Strength Index (RSI) for the token was positioned beneath the 50 neutral region. Found marking a spot at the 44.43 in a downward curve, the RSI appeared to be seeking solace in the oversold territory. Similarly, with a Money Flow index (MFI) of 41.57 and a further move in the downwards direction, the last 24 hours have been marked with a significant distribution of the AAVE tokens.
Piggybacking off the general price retracement that hit the crypto market in May following the bloodbath in April, a look at the MACD revealed a bullish reaction on 19 May. However, at press time, a reversal in the progression of the MACD was spotted with the MACD line gearing up to intersect the trend line in a downward direction; indicative of a bearish bias.

All is not well in ghost town
On-chain analysis revealed that apart from a decline in price, the AAVE token suffered losses in other respects in the last 24 hours.
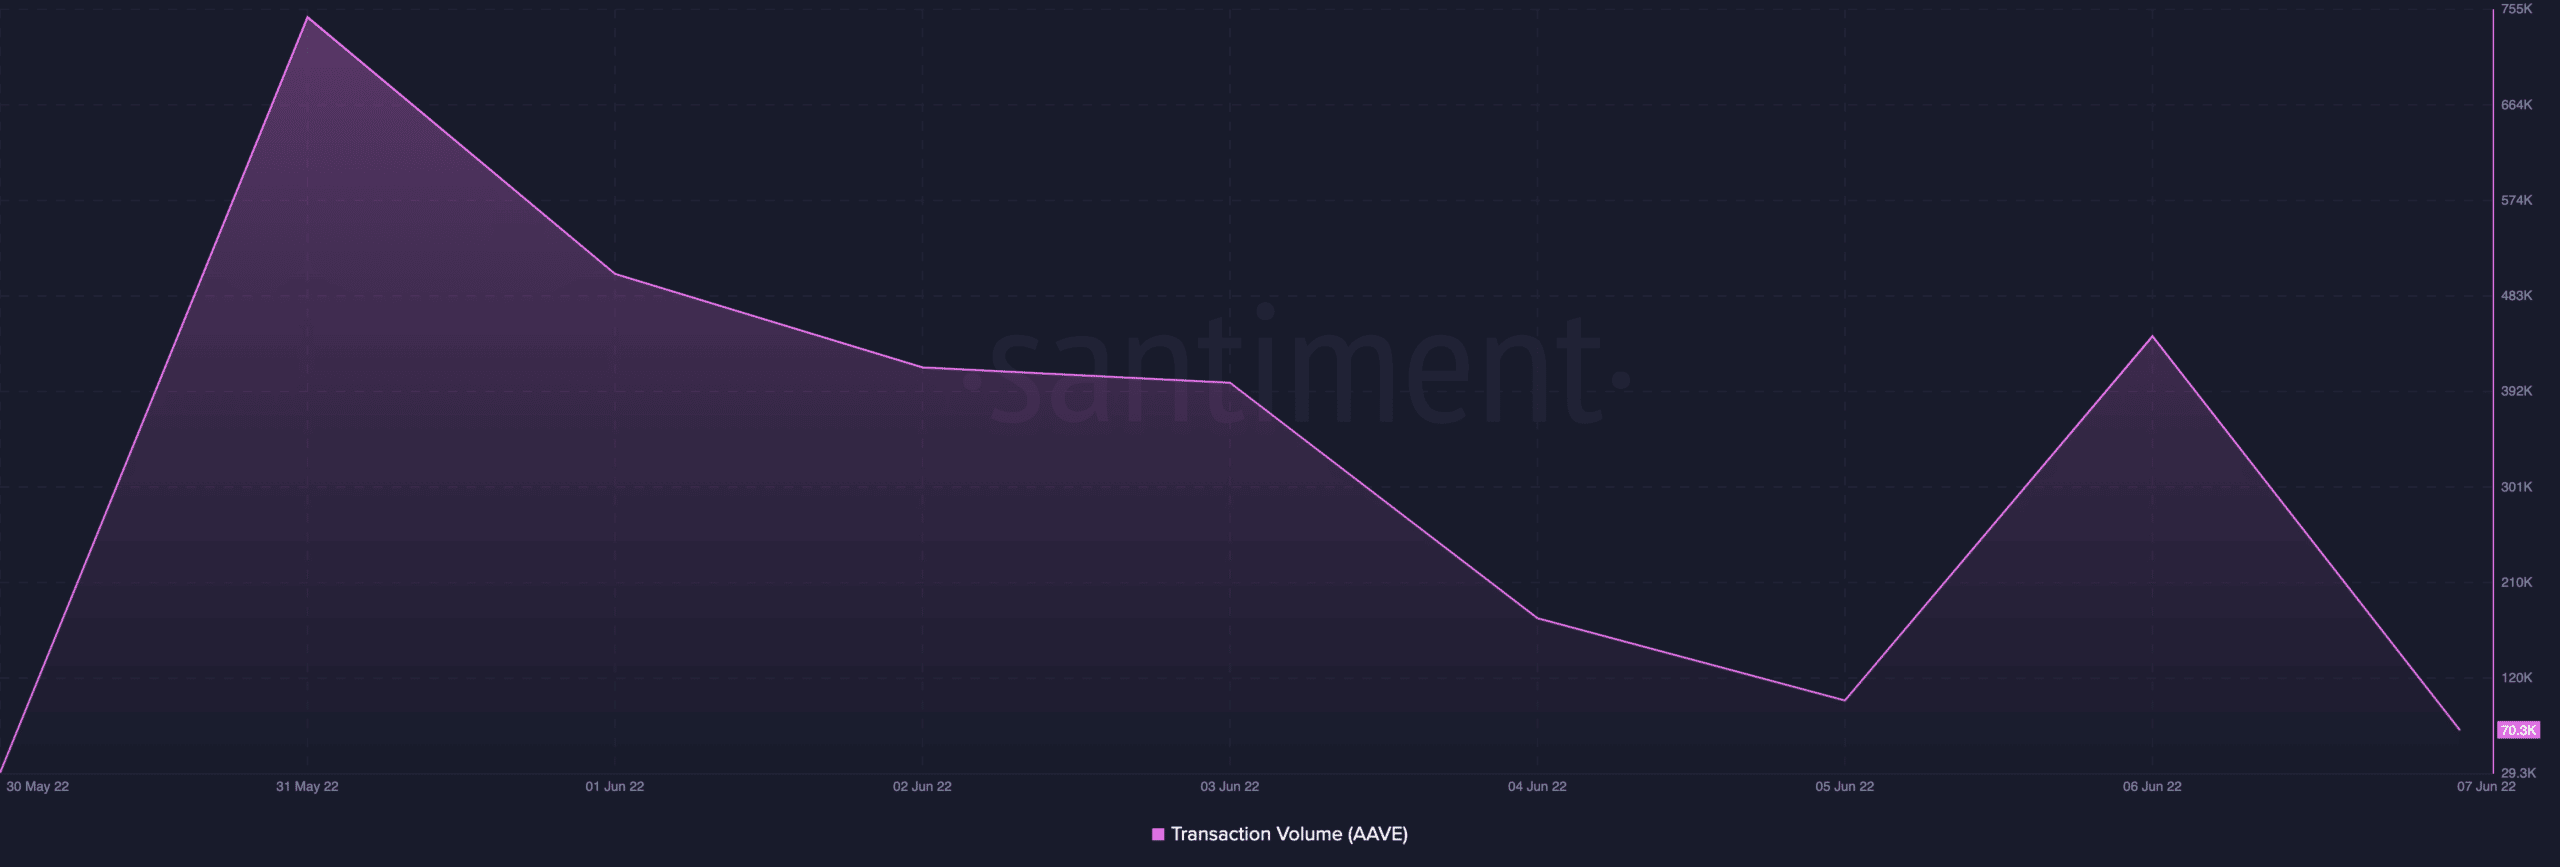
In transaction volume, the AAVE token recorded a total of 444.93k on 6 June. However, this went on to fall by over 80% during the course of the last 24 hours to be pegged at 70.3k at press time.
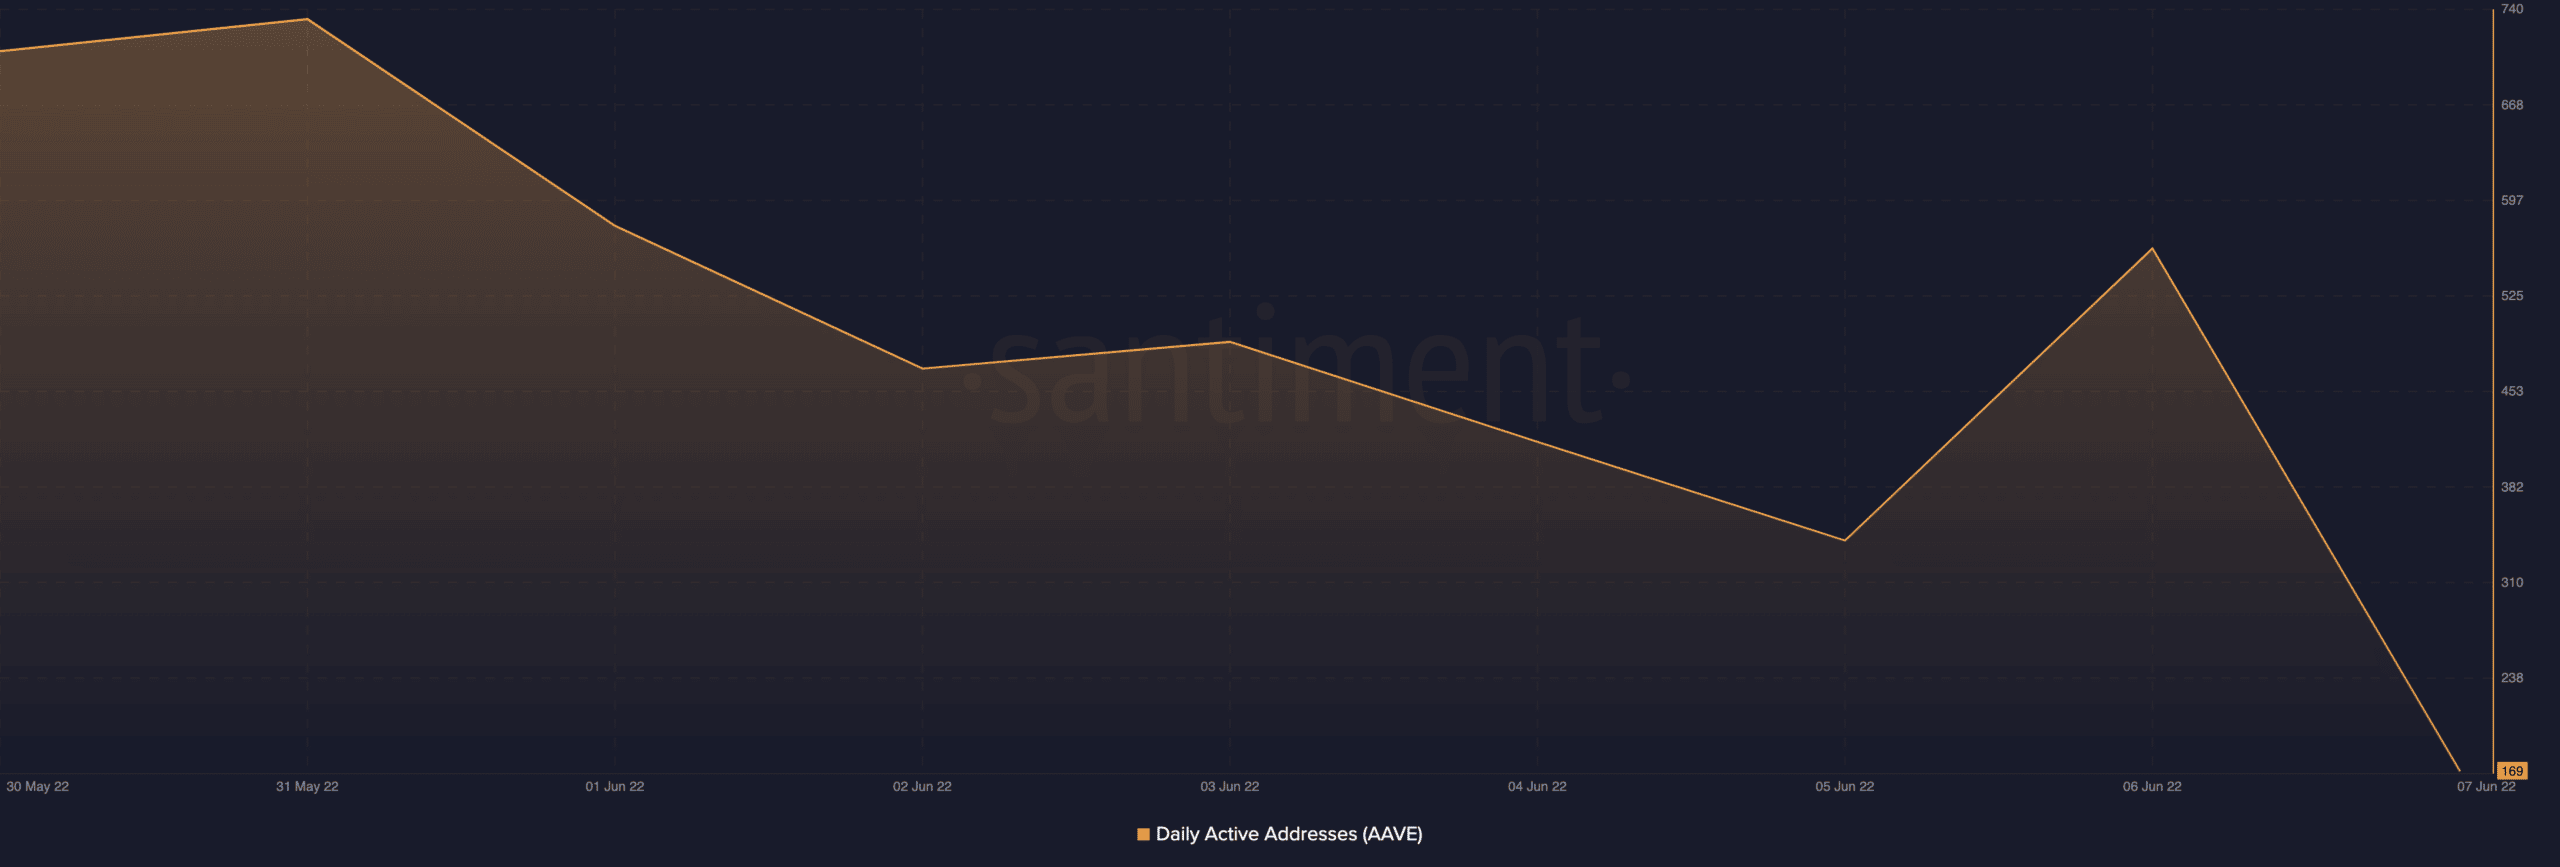
Further to this, the number of unique addresses transacting the AAVE token saw a fall in the last 24 hours. Marking a spot at 561 on Monday (6 June), this dropped by 69% in the last 24 hours and recorded a daily active address index of 169 at press time.
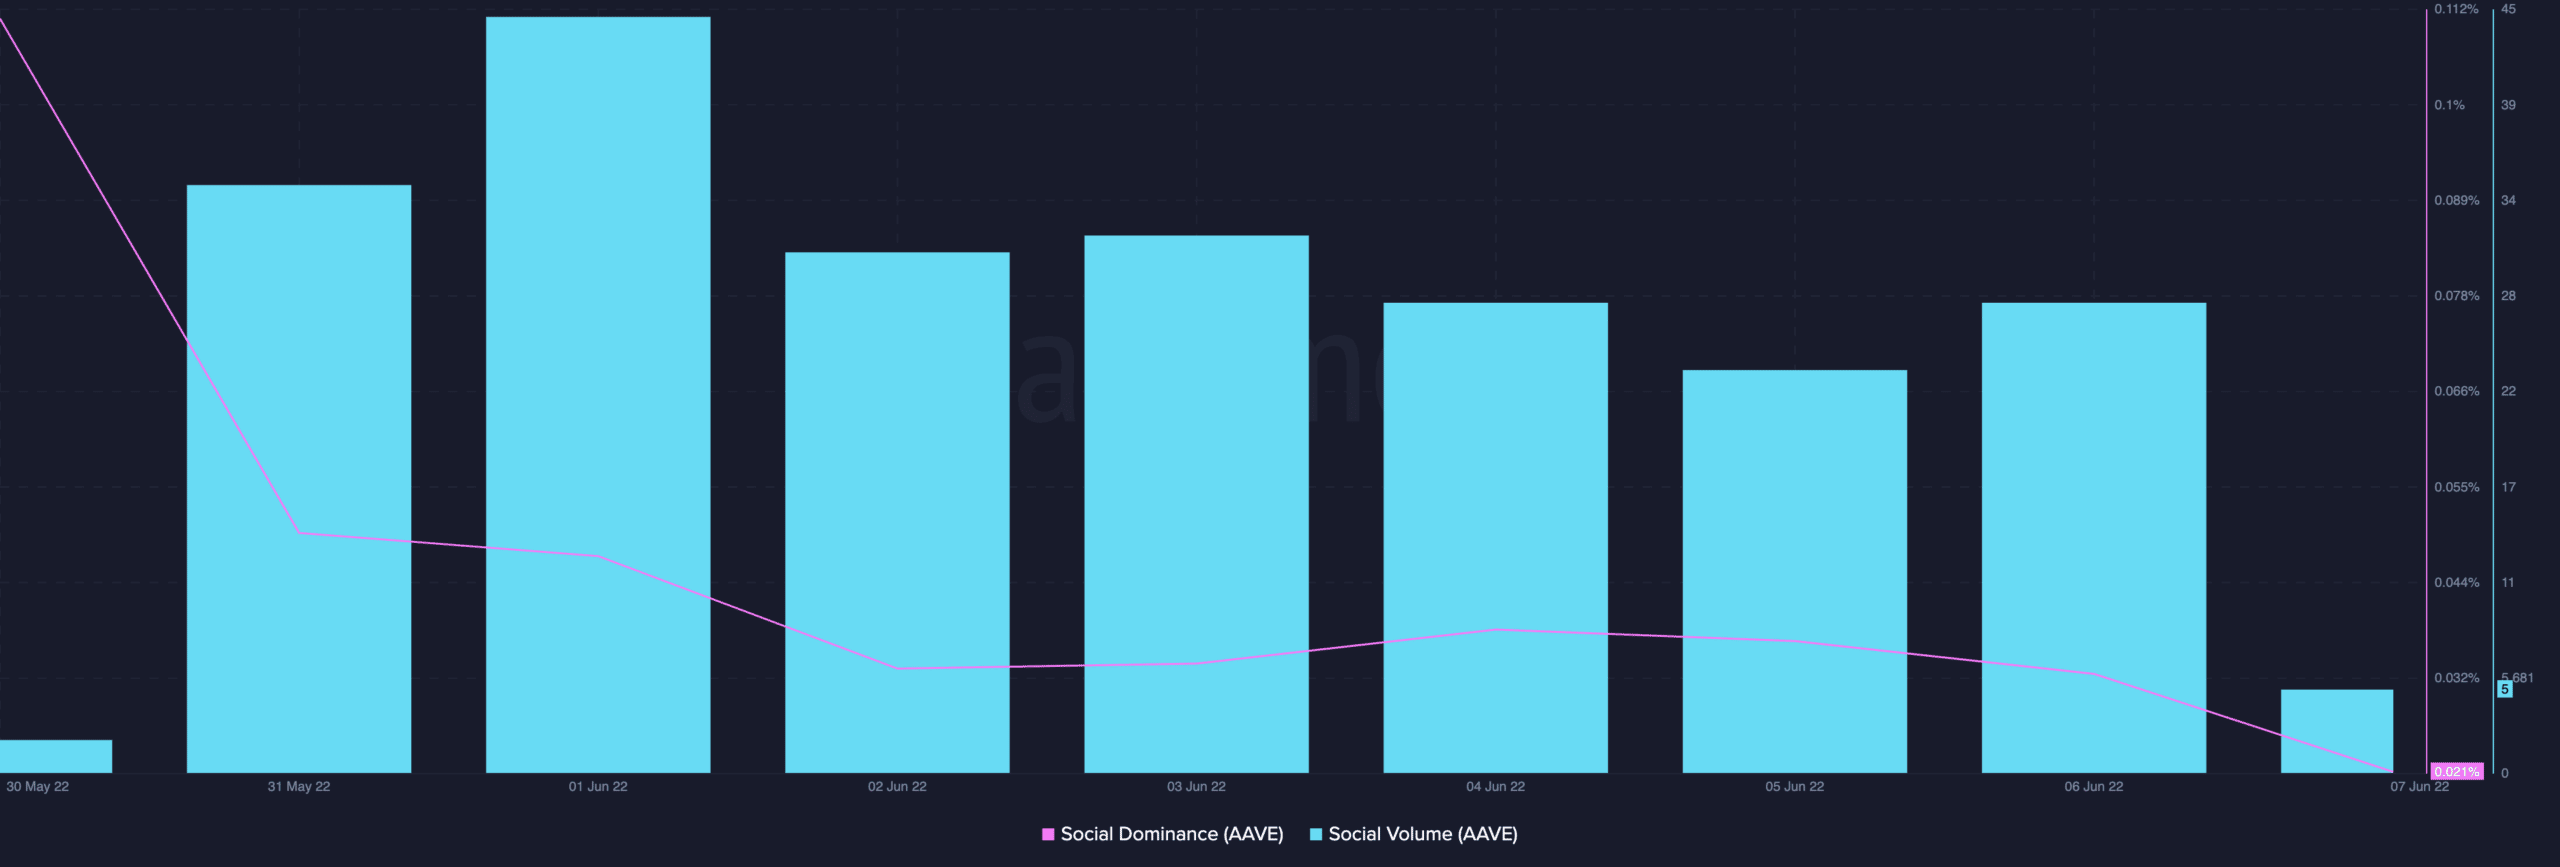
On a social front, the token also saw some losses in the past 24 hours. 0.022% at press time, the social dominance went down by 31%. In fact, the social volume also recorded an 82% loss in the last 24 hours.
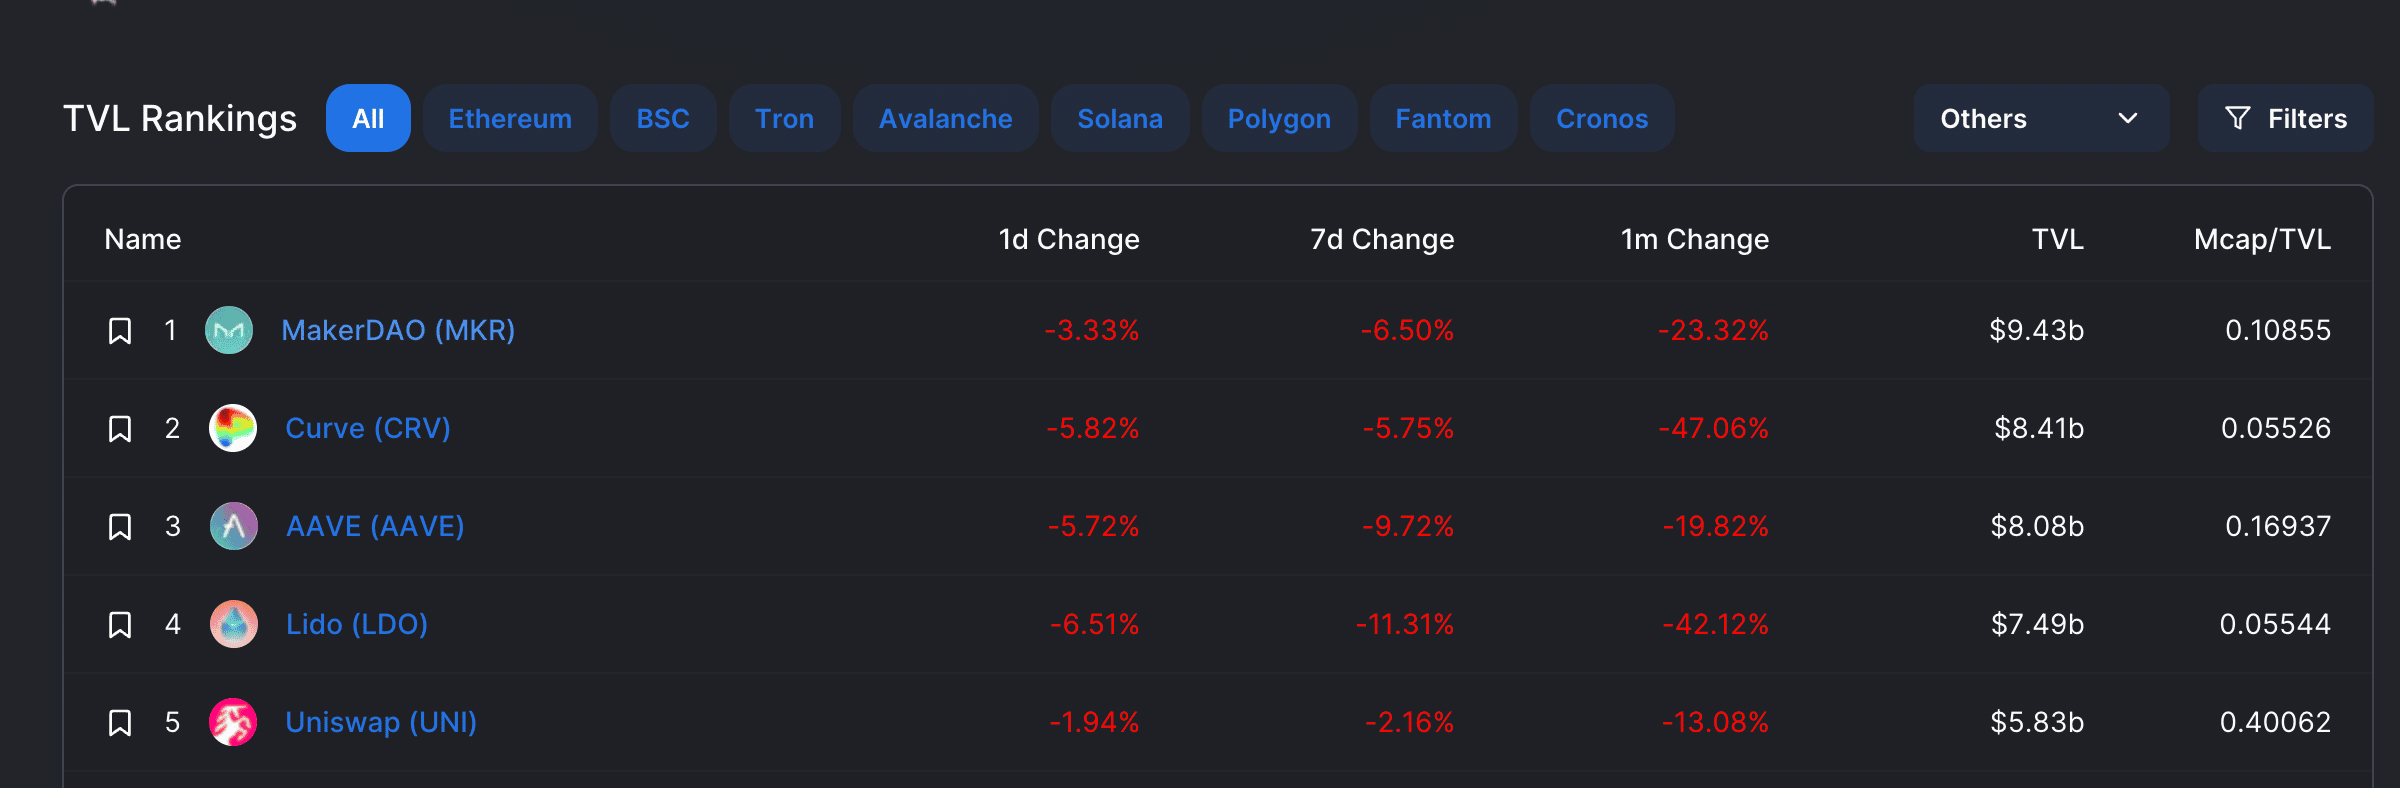
Although its native token might have suffered some losses in the last 24 hours, data from DefiLlama showed that the Aave Protocol is ranked number three on the list of Decentralized Finance (DeFi) protocols with the largest Total Value Locked (TVL).