Decoding how Ethereum traders can take advantage of rising wedge

Disclaimer: The findings of the following analysis are the sole opinions of the writer and should not be considered investment advice.
Over the last few days, Ethereum’s [ETH] revival from the $900-zone saw a reversal from its one-month trendline resistance (white, dashed). The string of recent red candlesticks has brought ETH into a near-term bearish control.
The repercussions of the Bitcoin sentiment have fueled the fear sentiment in the altcoin market. ETH’s fall below the $ 1,090 level pulled ETH to its January 2021 lows on 19 June.
As the gradual recovery phase continues, a potential rebound from the $1,125 support could retest the month-long trendline resistance. At press time, ETH traded at $1,129.6, down by 6.19% in the last 24 hours.
ETH 4-hour Chart
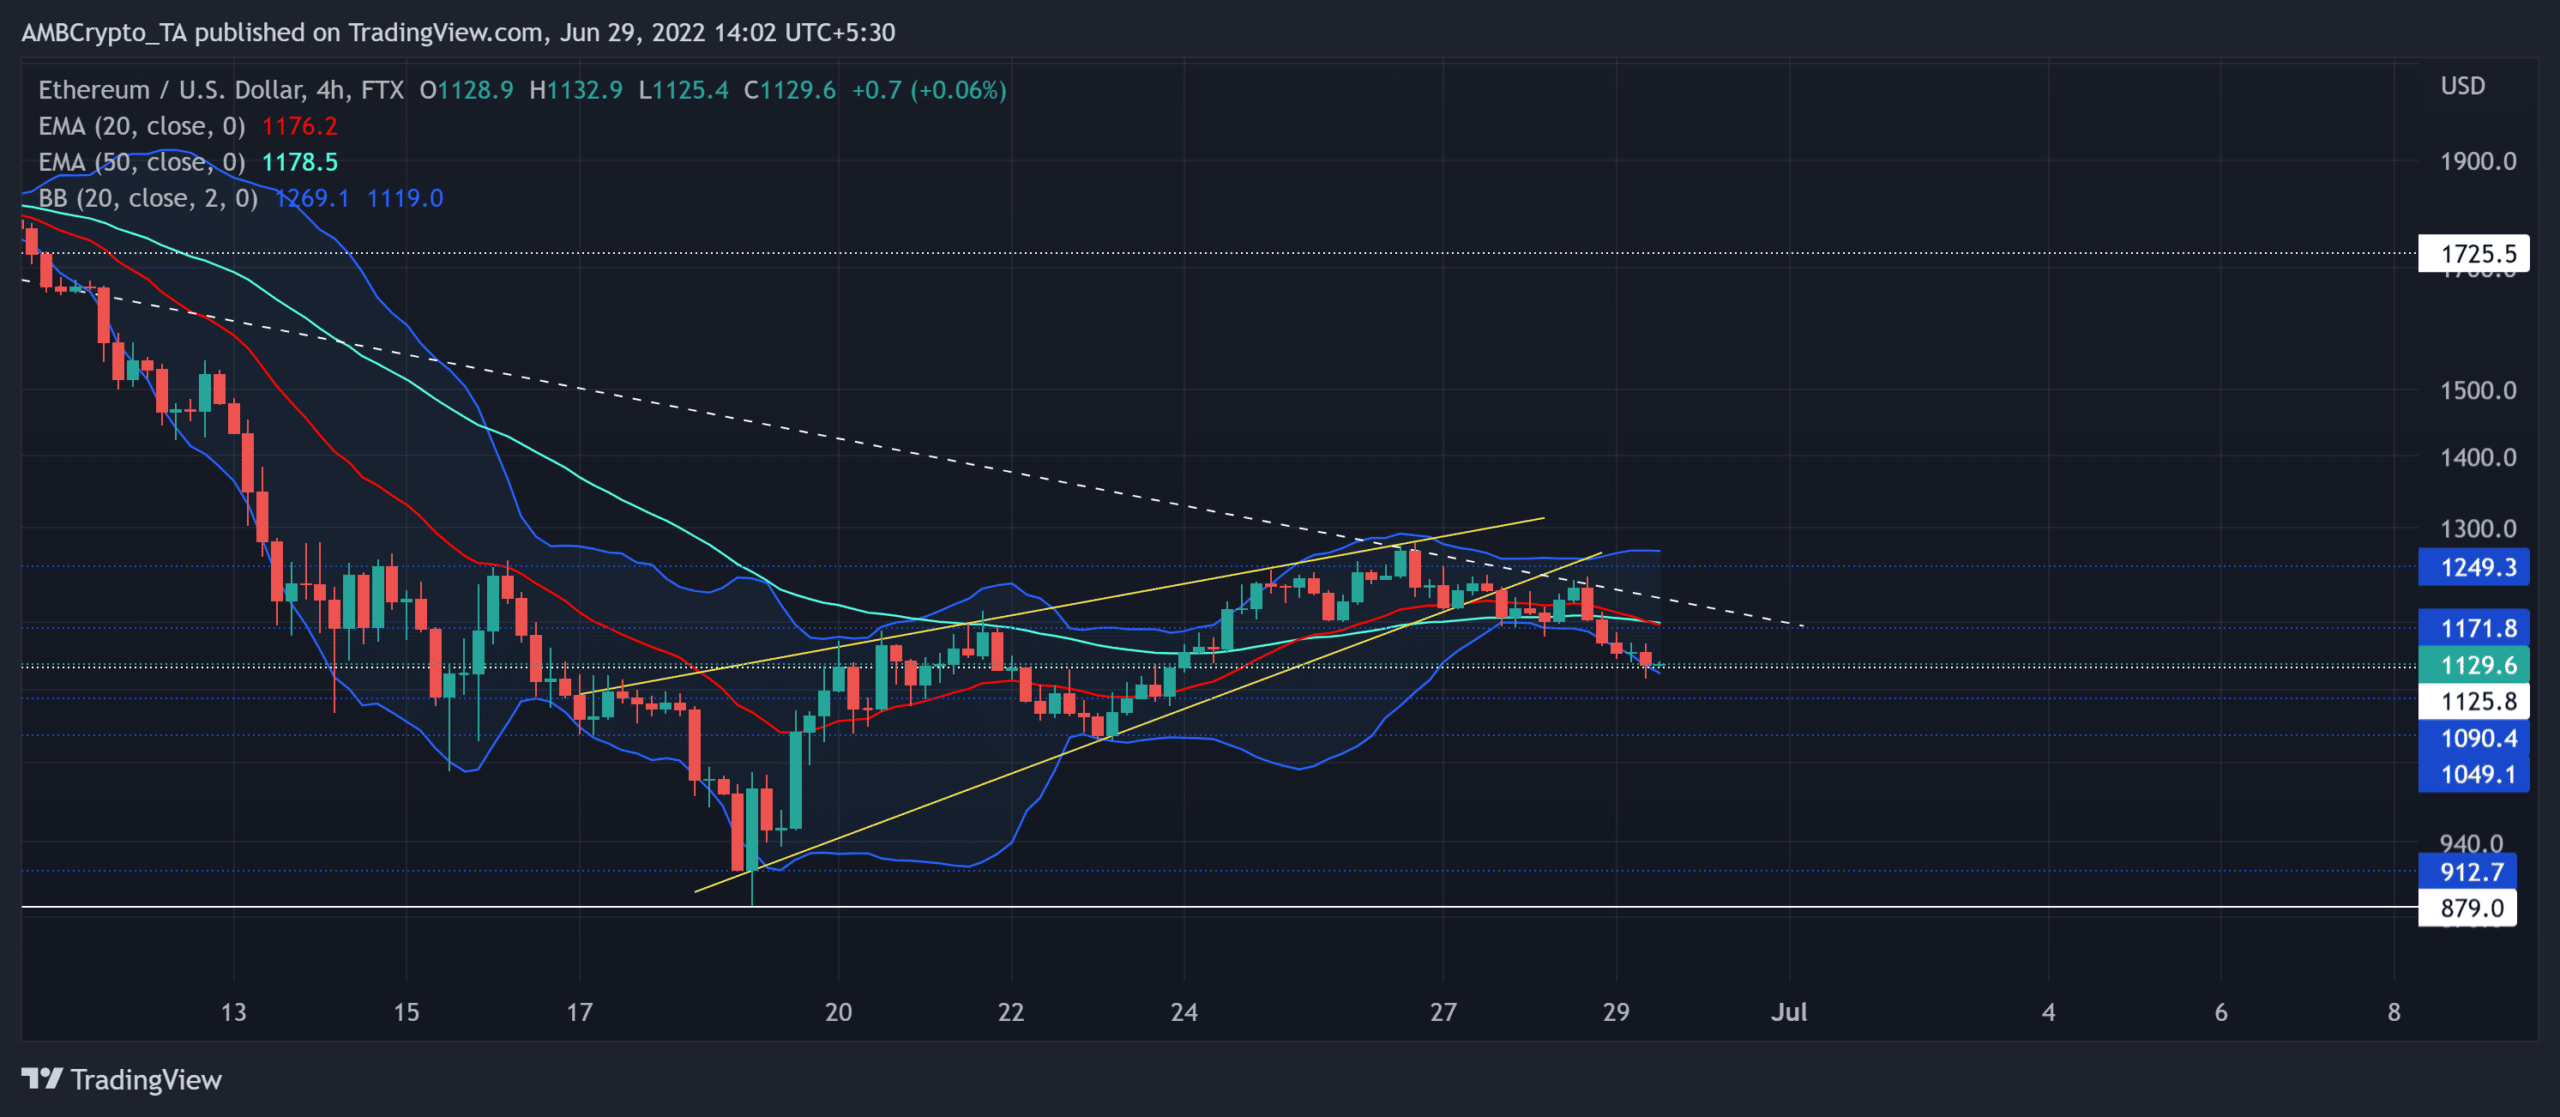
ETH’s Bollinger Bands (BB) have revealed a bearish control while the price was hovering near its lower band. The altcoin still had to break the boundary of its $ 1,200 zone to inflict a trend-altering rally.
During its previous retracements, ETH lost more than half its value in just nine days (from 10 June). Consequently, the alt gravitated toward its 17-month low on 19 June.
With the $900-zone triggering a near-term buying come back, it gave the ETH a much-needed push toward the month-long trendline resistance. During this phase, ETH oscillated between a rising wedge in the four-hour timeframe.
After an expected breakdown from this pattern, the 20 EMA (red) looked south and fell below the 50 EMA (cyan). This bearish crossover can impair the buying power in the coming days.
A rebound from the immediate support can help the bulls retest the $1,200 zone. Post this, the month-long trendline resistance could continue to pose barriers. However, an extended decline below the $1,125 level could expose the alt to a test of the $1,049-$1,090 range.
Rationale
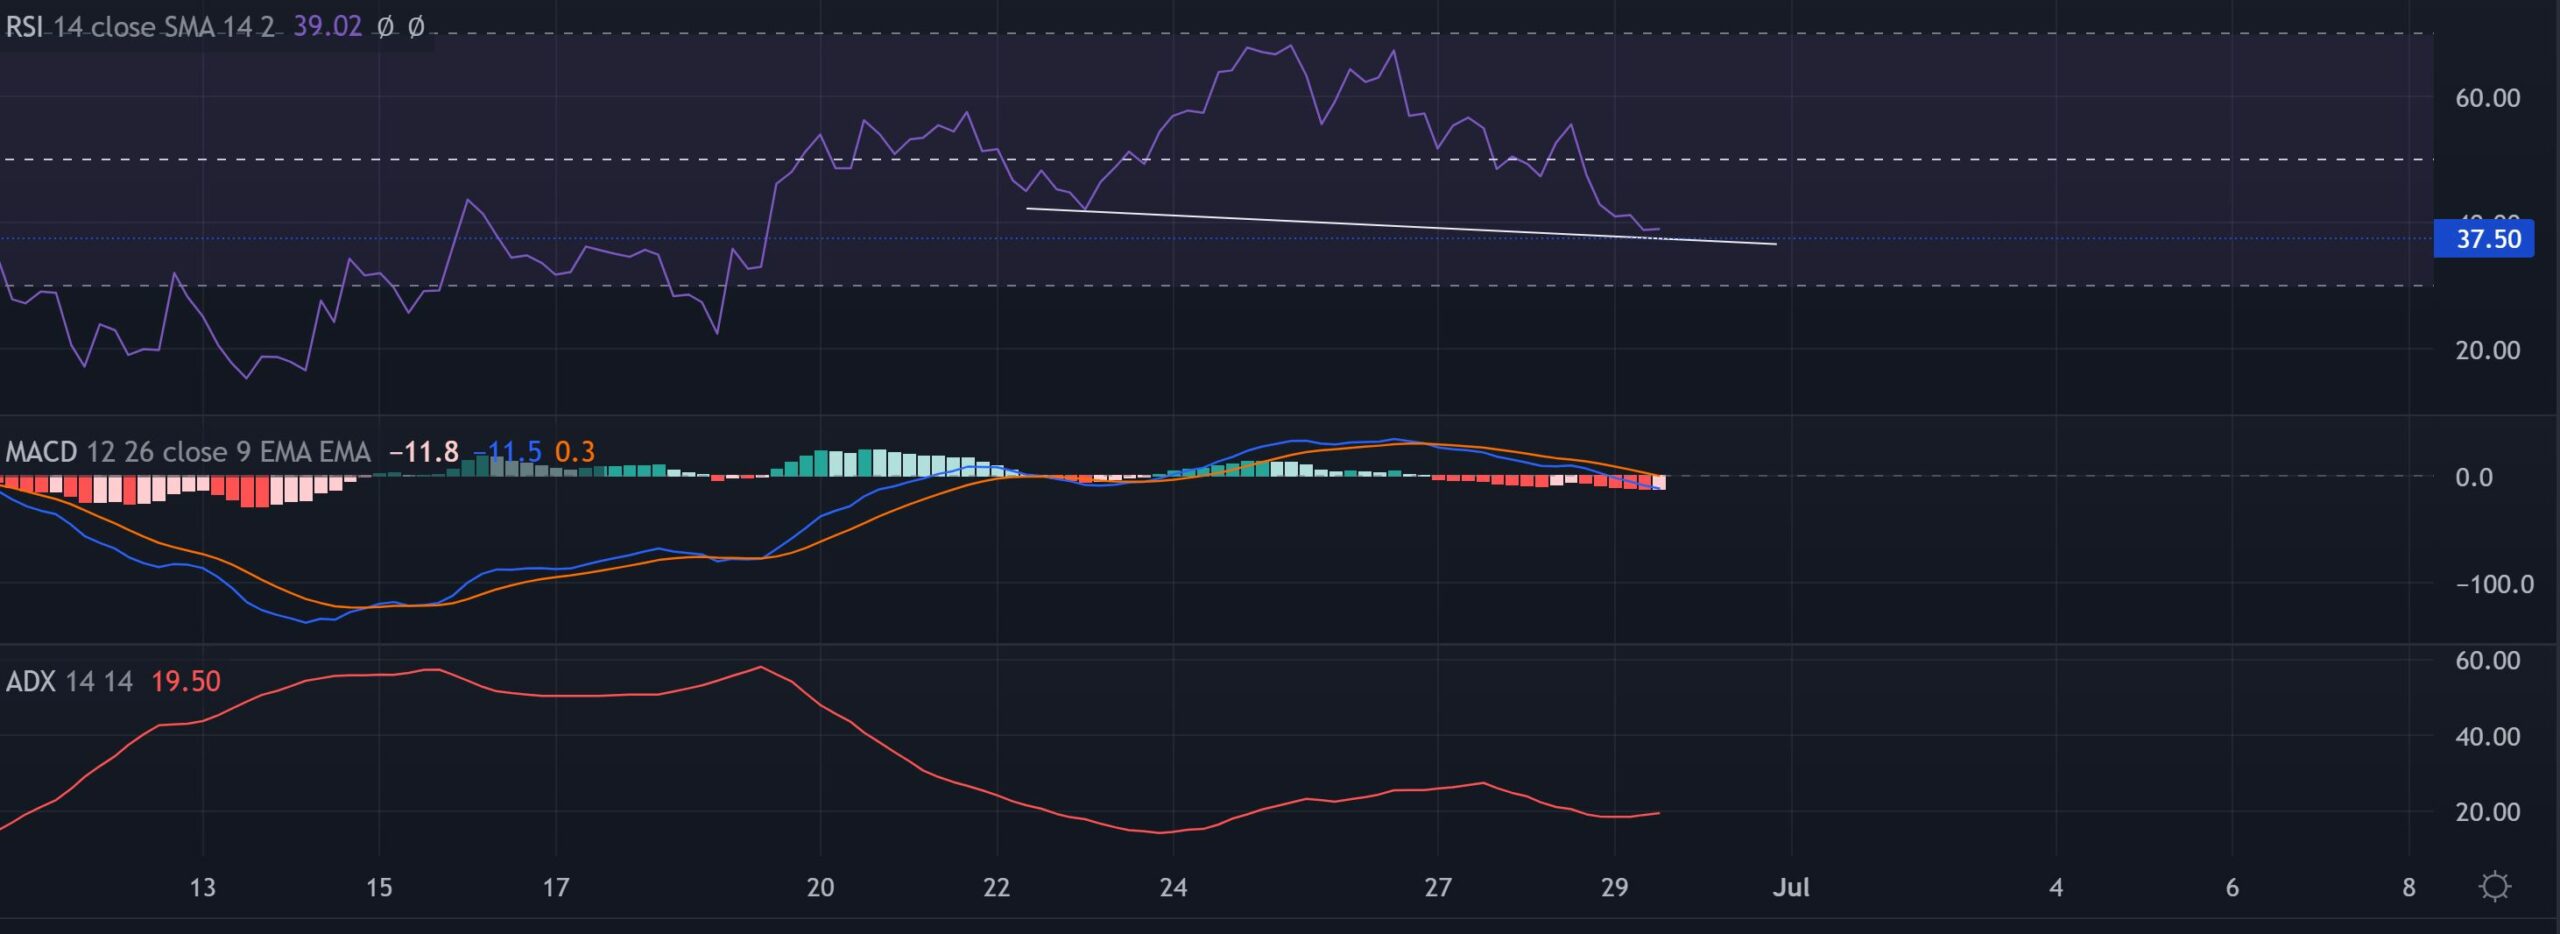
The Relative Strength Index (RSI) displayed a strong bearish control. As the index plunged toward the 37-mark, any revival from its trendline and horizontal support can affirm a bullish divergence with price.
But with the MACD lines falling below the zero-mark, buyers still have a long way to steer the trend in their favor. Nevertheless, the ADX revealed a substantially weak directional trend for the alt.
Conclusion
The bulls needed to amplify the buying volumes at the $1,125 support to prevent a downside risk of 6-7%. An immediate rebound can help ETH’s efforts to bounce back toward the $1,200 zone before any trend-impacting move.
Finally, investors/traders need to watch out for Bitcoin’s movement. This is because ETH shares a whopping 99% 30-day correlation with the king coin.


