Dogecoin, Avalanche, GALA Price Analysis: 09 March
Although the market saw decent gains over the last 24 hours, the overall sentiment refrained from improving the ‘extreme fear’ feeling. With these gains, Dogecoin, Avalanche and GALA saw a patterned breakout from their down-channels on the 4-hour chart.
Dogecoin (DOGE)
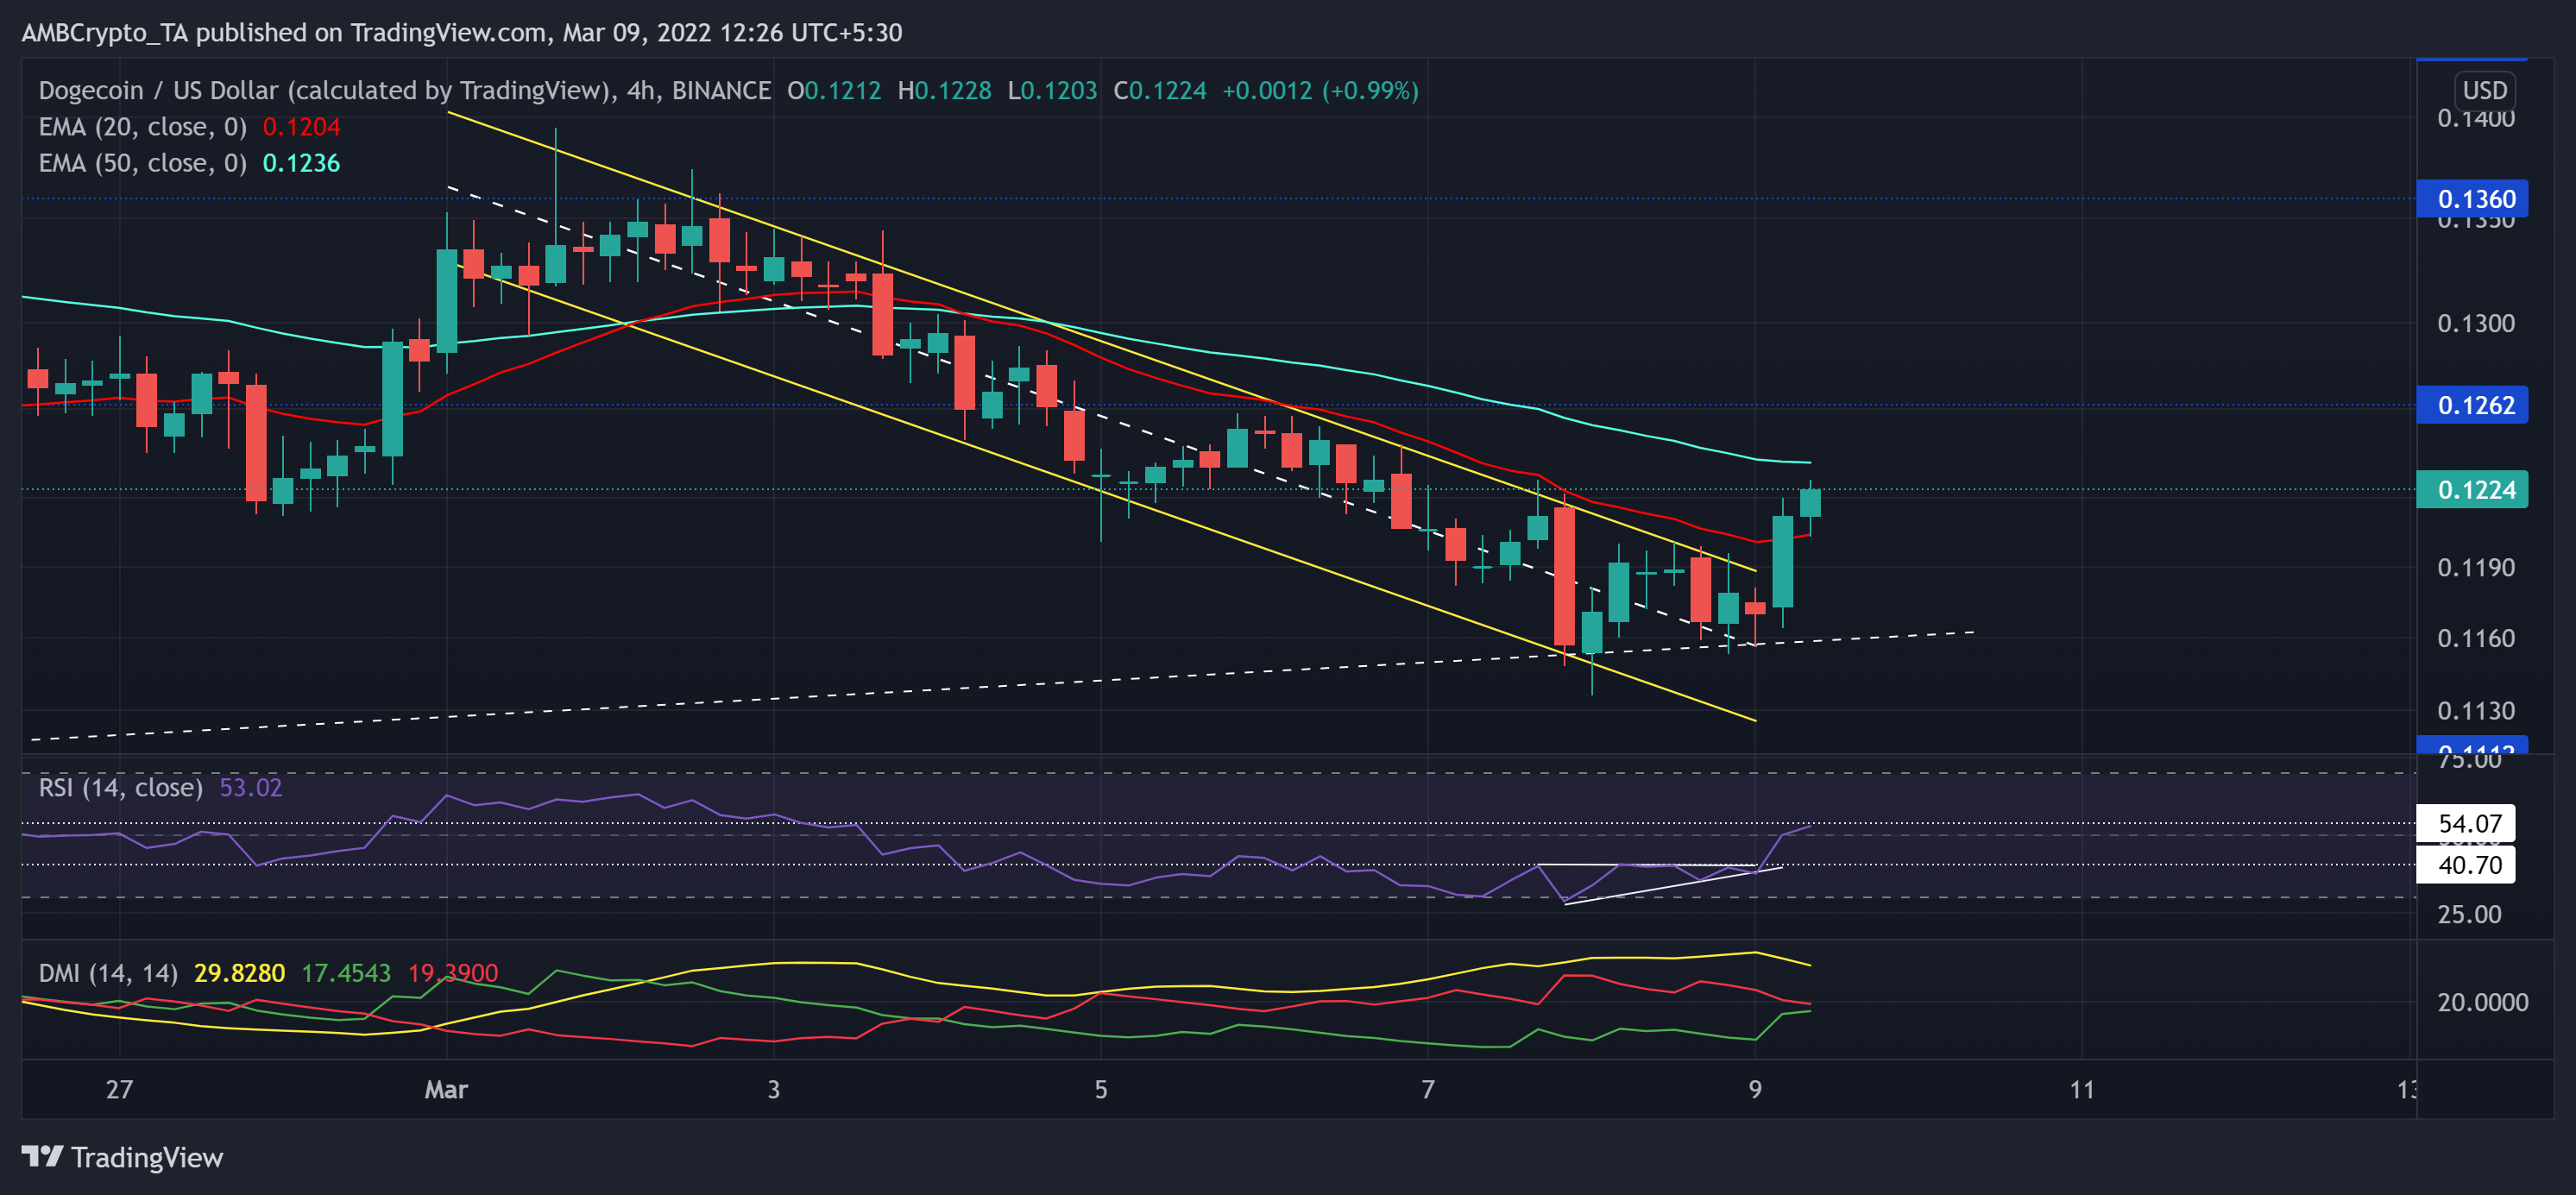
After nosediving to its ten-month low on 24 February, DOGE recovered its previous losses by registering a 30.5% ROI and testing the $0.136-level.
As the sellers stepped in at the $0.136-resistance, DOGE withdrew in a down-channel (yellow) over the last nine days. This pullback found support at its two-week trendline support near the $0.115-mark. Consequently, the bulls found a patterned breakout and jumped above its 4-hour 20 EMA. The immediate hurdle for the alt was still at the 50 EMA (cyan).
At press time, DOGE traded at $0.1224. After heading into the oversold region, the RSI revived in an ascending triangle. As a result, it broke above the 40-mark resistance as the buyers stepped in to claim an edge. Now, the 53-level could pose a barrier as the sellers endeavour to counter the bullish pressure. Also, the DMI lines reaffirmed the increasing buying influence but were yet to witness a bullish crossover.
Avalanche (AVAX)
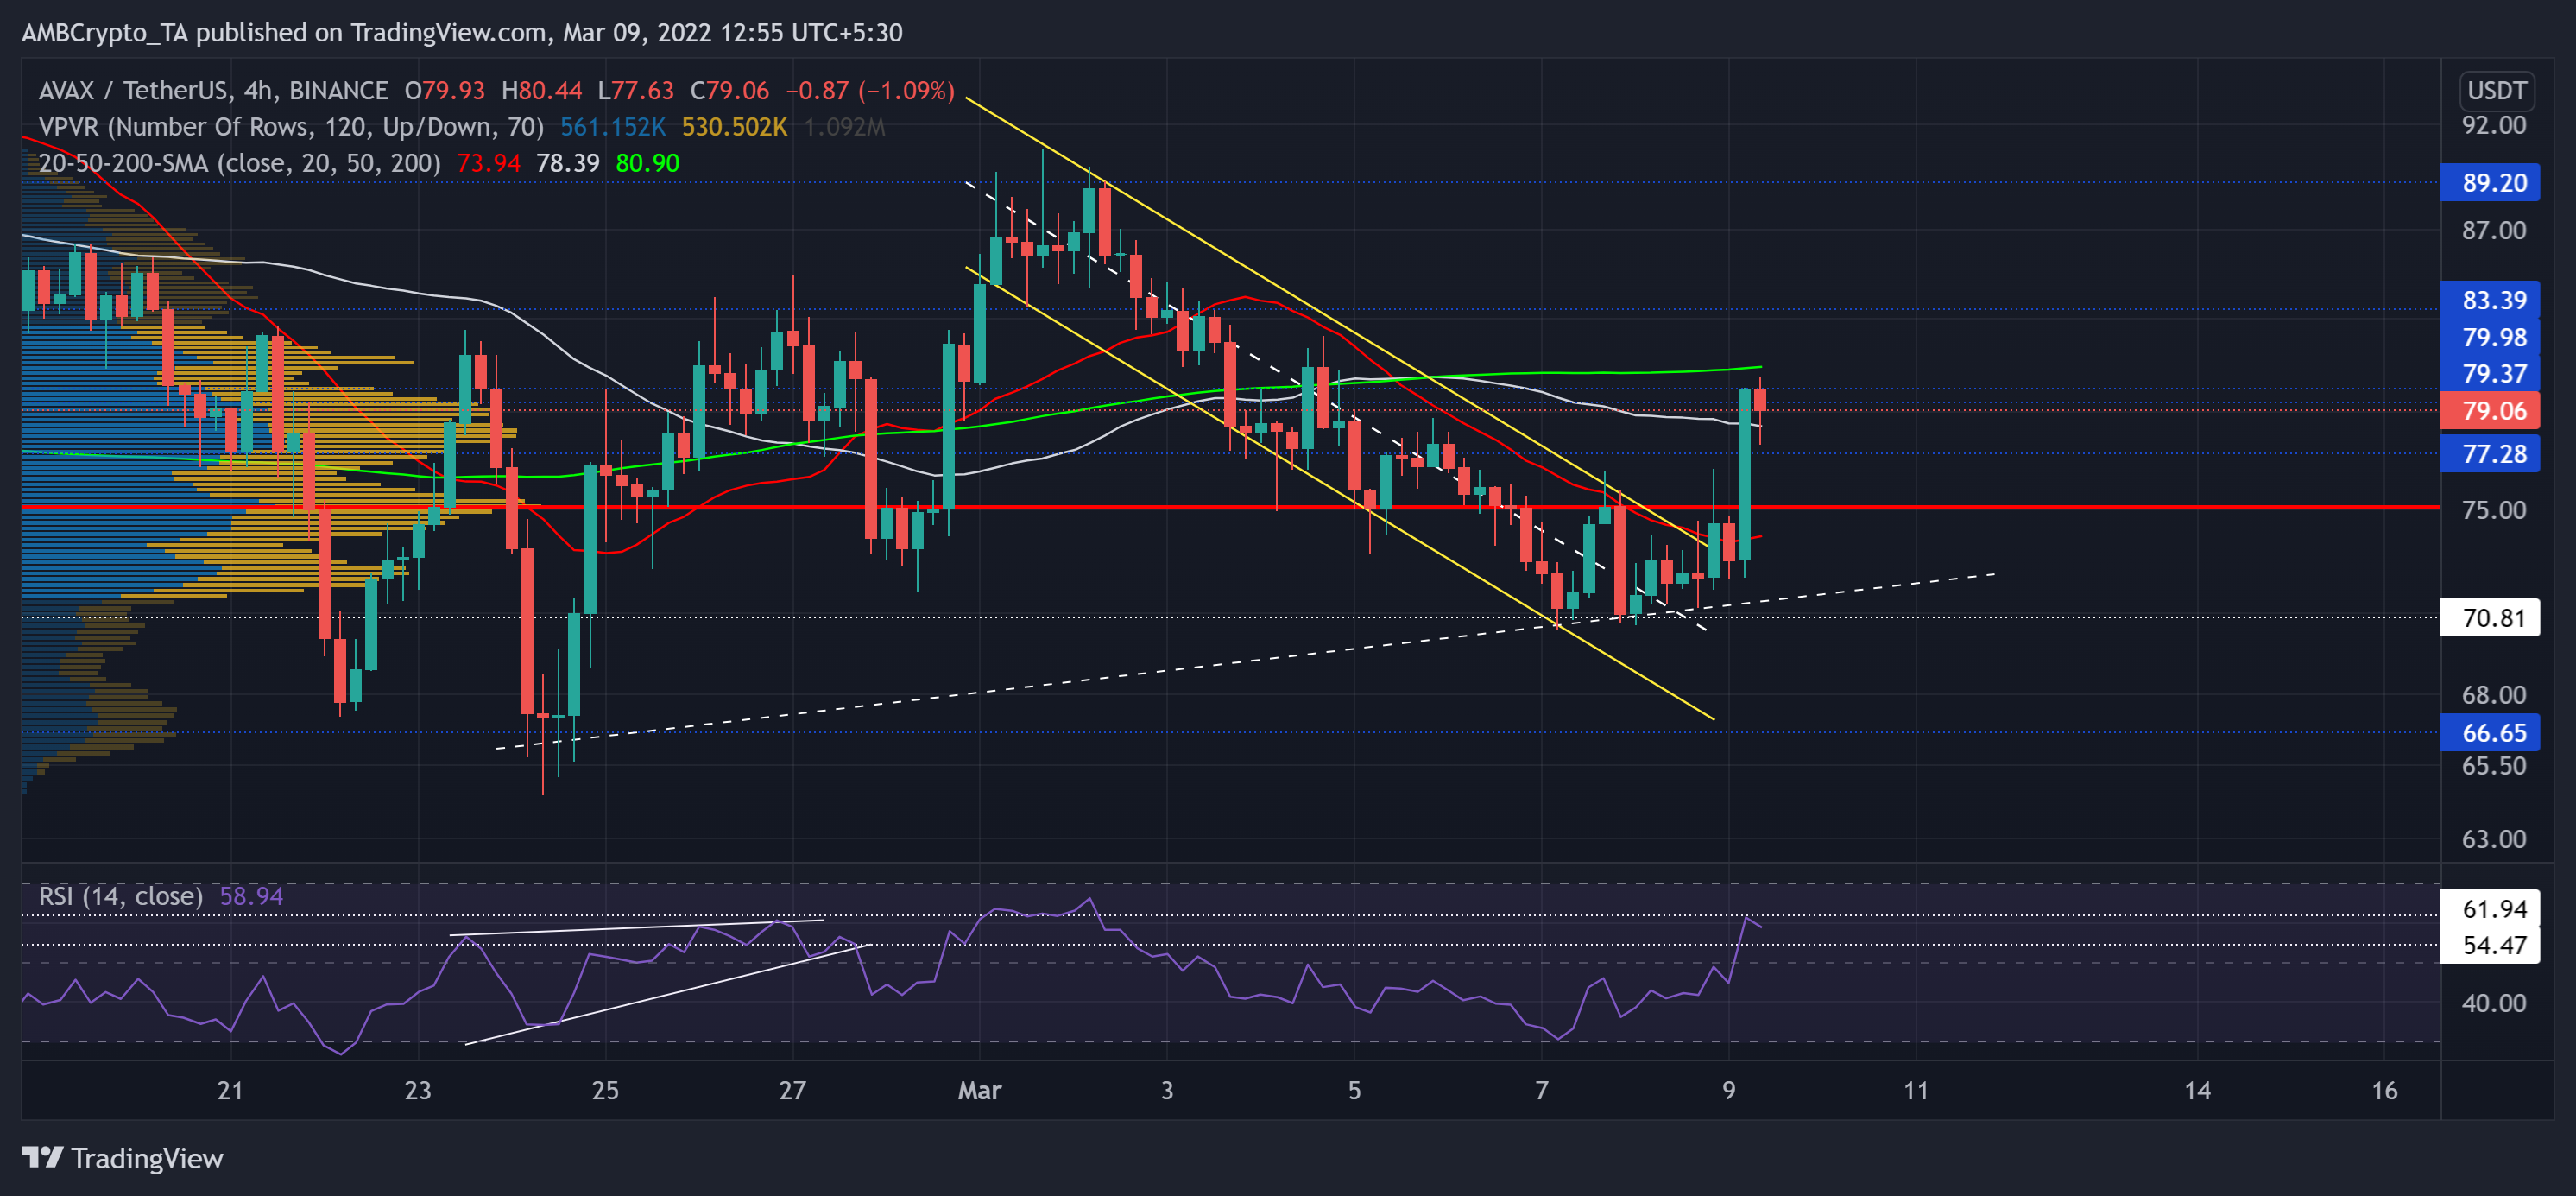
As the bulls finally gathered enough impetus from its January lows, AVAX noted staggering 85.2% gains until 17 February. Then, the alt found itself on the back foot as the bears tested the $66-floor.
The most recent bearish phase marked a down-channel (yellow) that led AVAX below its Point of Control (red, POC). But, in light of the increasing bullish vigor over the last two weeks, buyers controlled the $70-mark while propelling a close above its POC. Thus, the patterned breakout supported the alt on its way above the 20-50 SMA. Now, the 200 SMA could see a prolonged clash between the buyers and sellers.
At press time, AVAX was trading at $79.06 after noting 10.21% 24-hour gains. As it hovered above equilibrium, the bullish RSI saw a 28-point surge in two days. Any near-term pullback from here could find testing support near the 54-point.
GALA
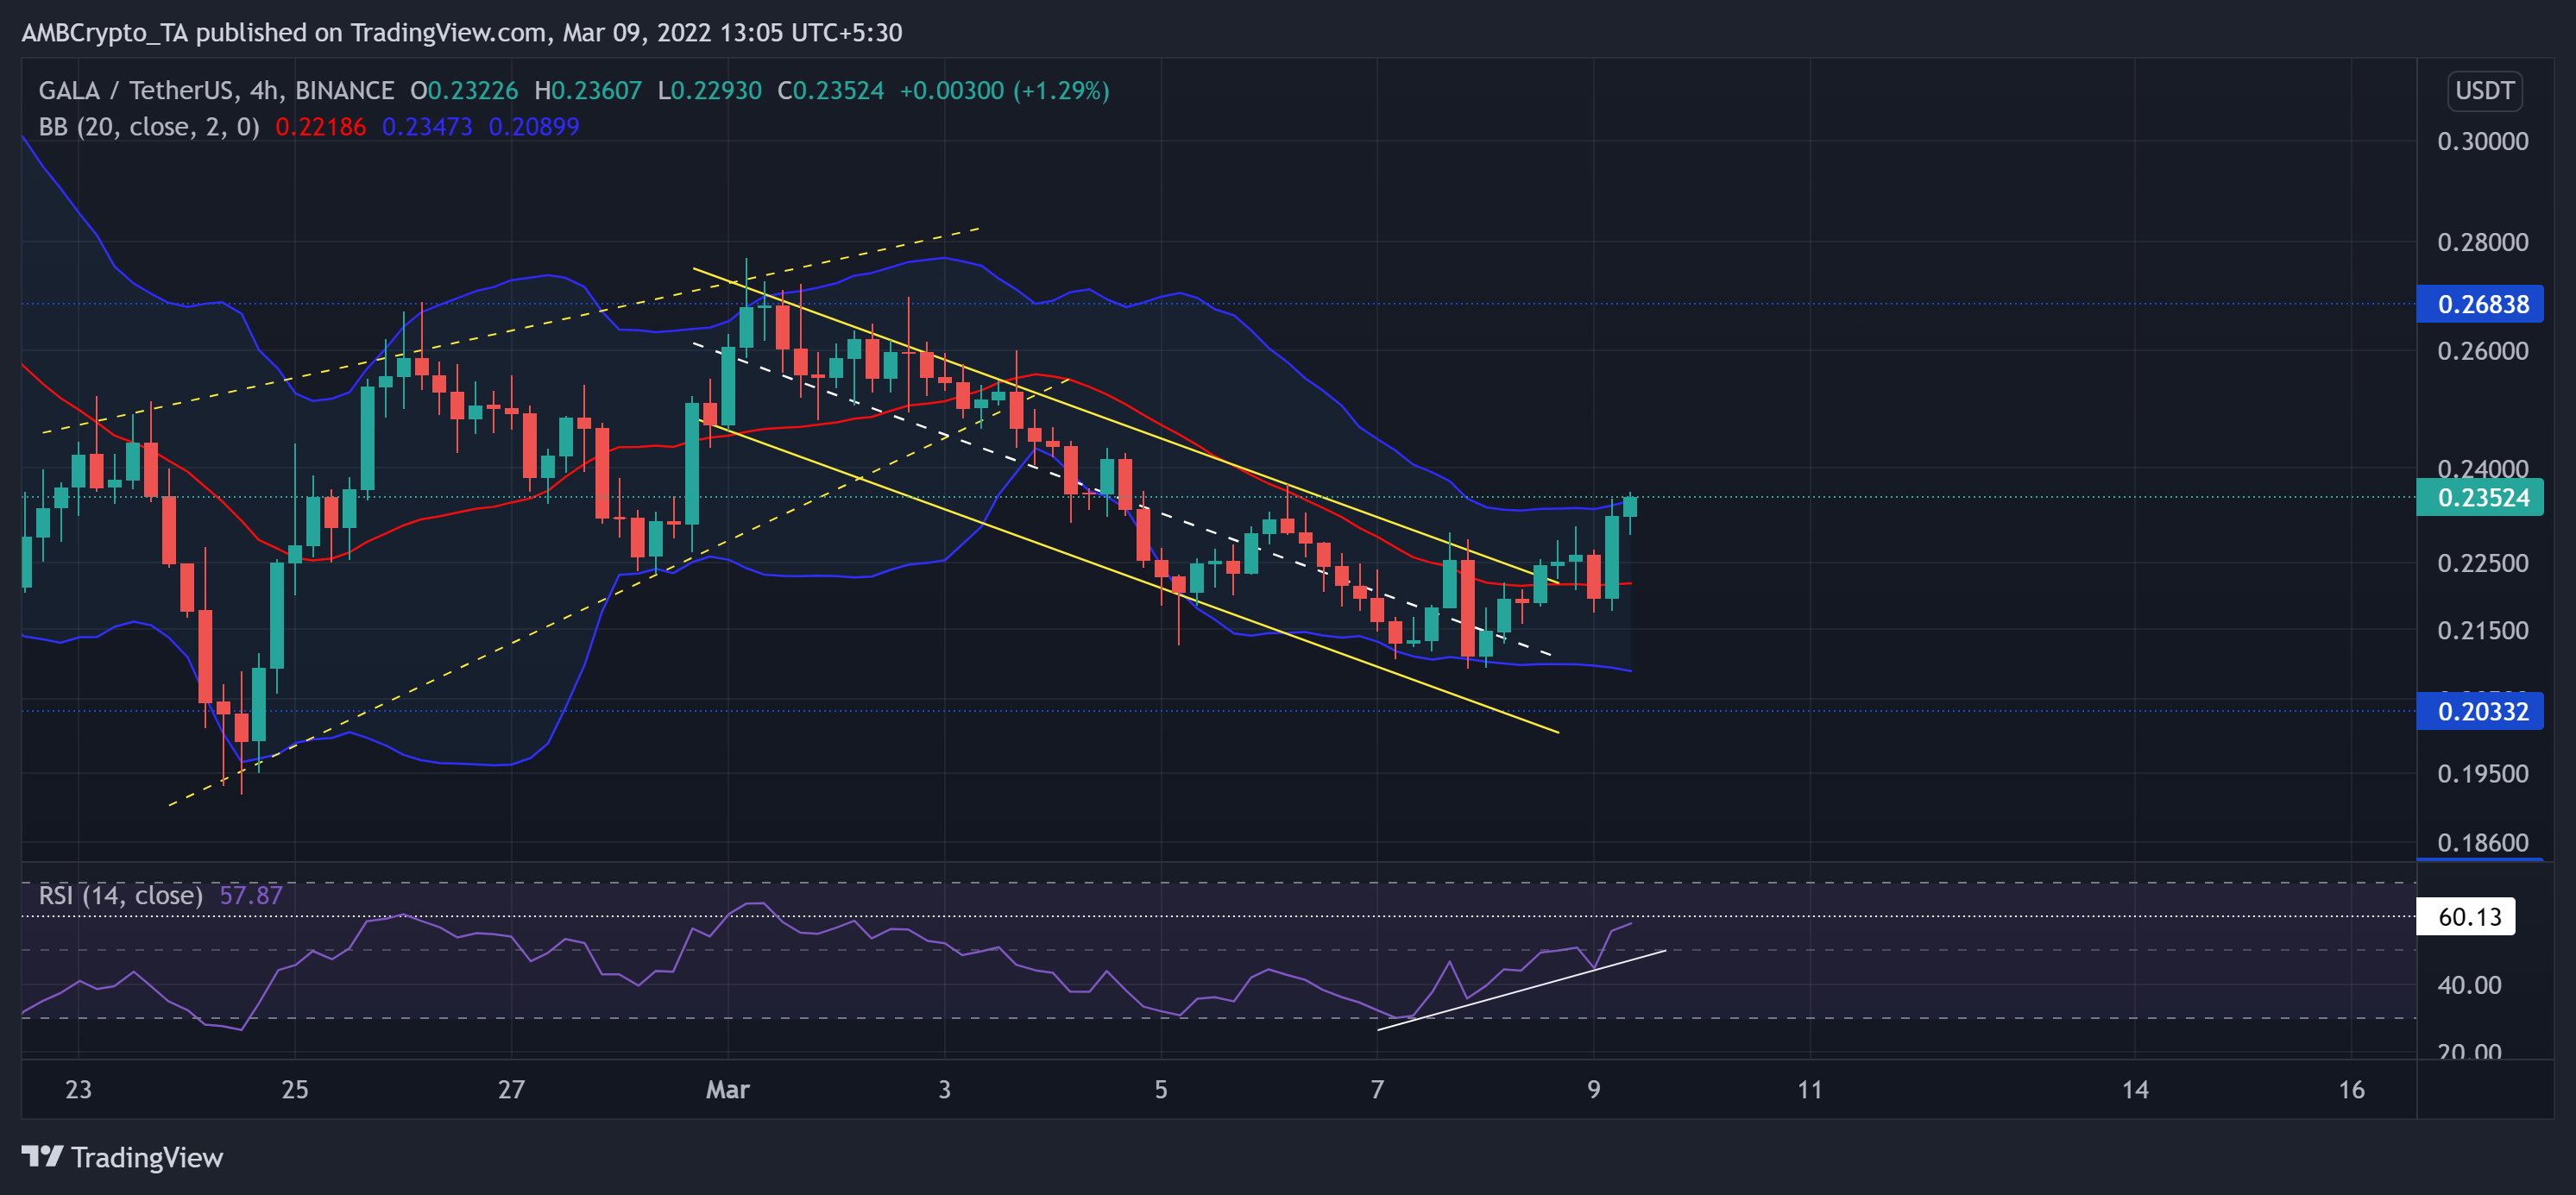
GALA lost its advantage after it failed to protect the $0.421-level. Since losing this mark, it has been rangebound between the above level and the $0.181-mark.
The recent sell-off phase pushed GALA below the mean (red) of Bollinger Bands (BB). Even so, the bulls quickly responded by propelling over 11.96% gains from the lower band of the BB over the last day. From here on, the immediate support stood near the mean of BB.
At press time, GALA was trading at $0.23524. The RSI was on a solid uptrend after forming steep trendline support (white trendline). Now, it might eye a test of the 60-mark resistance.