Dogecoin will likely fall back into its trend, but only after…
Disclaimer: The findings of the following analysis are the sole opinions of the writer and should not be considered investment advice
Dogecoin (DOGE) oscillated between $0.3261 and $0.1685 for over seven months until the bears flipped the $0.1456-mark from support to resistance on 22 January. This bearish phase saw a long-term down-channel (white), one which pushed the alt below its 20-50 EMA.
From here on, a conclusive close above the $0.1355-resistance would brace DOGE for a re-test near its 20 EMA before a likely pullback from the $0.14-zone.
At press time, DOGE was trading at $0.1354, up by 3.8% in the last 24 hours.
Dogecoin Daily Chart
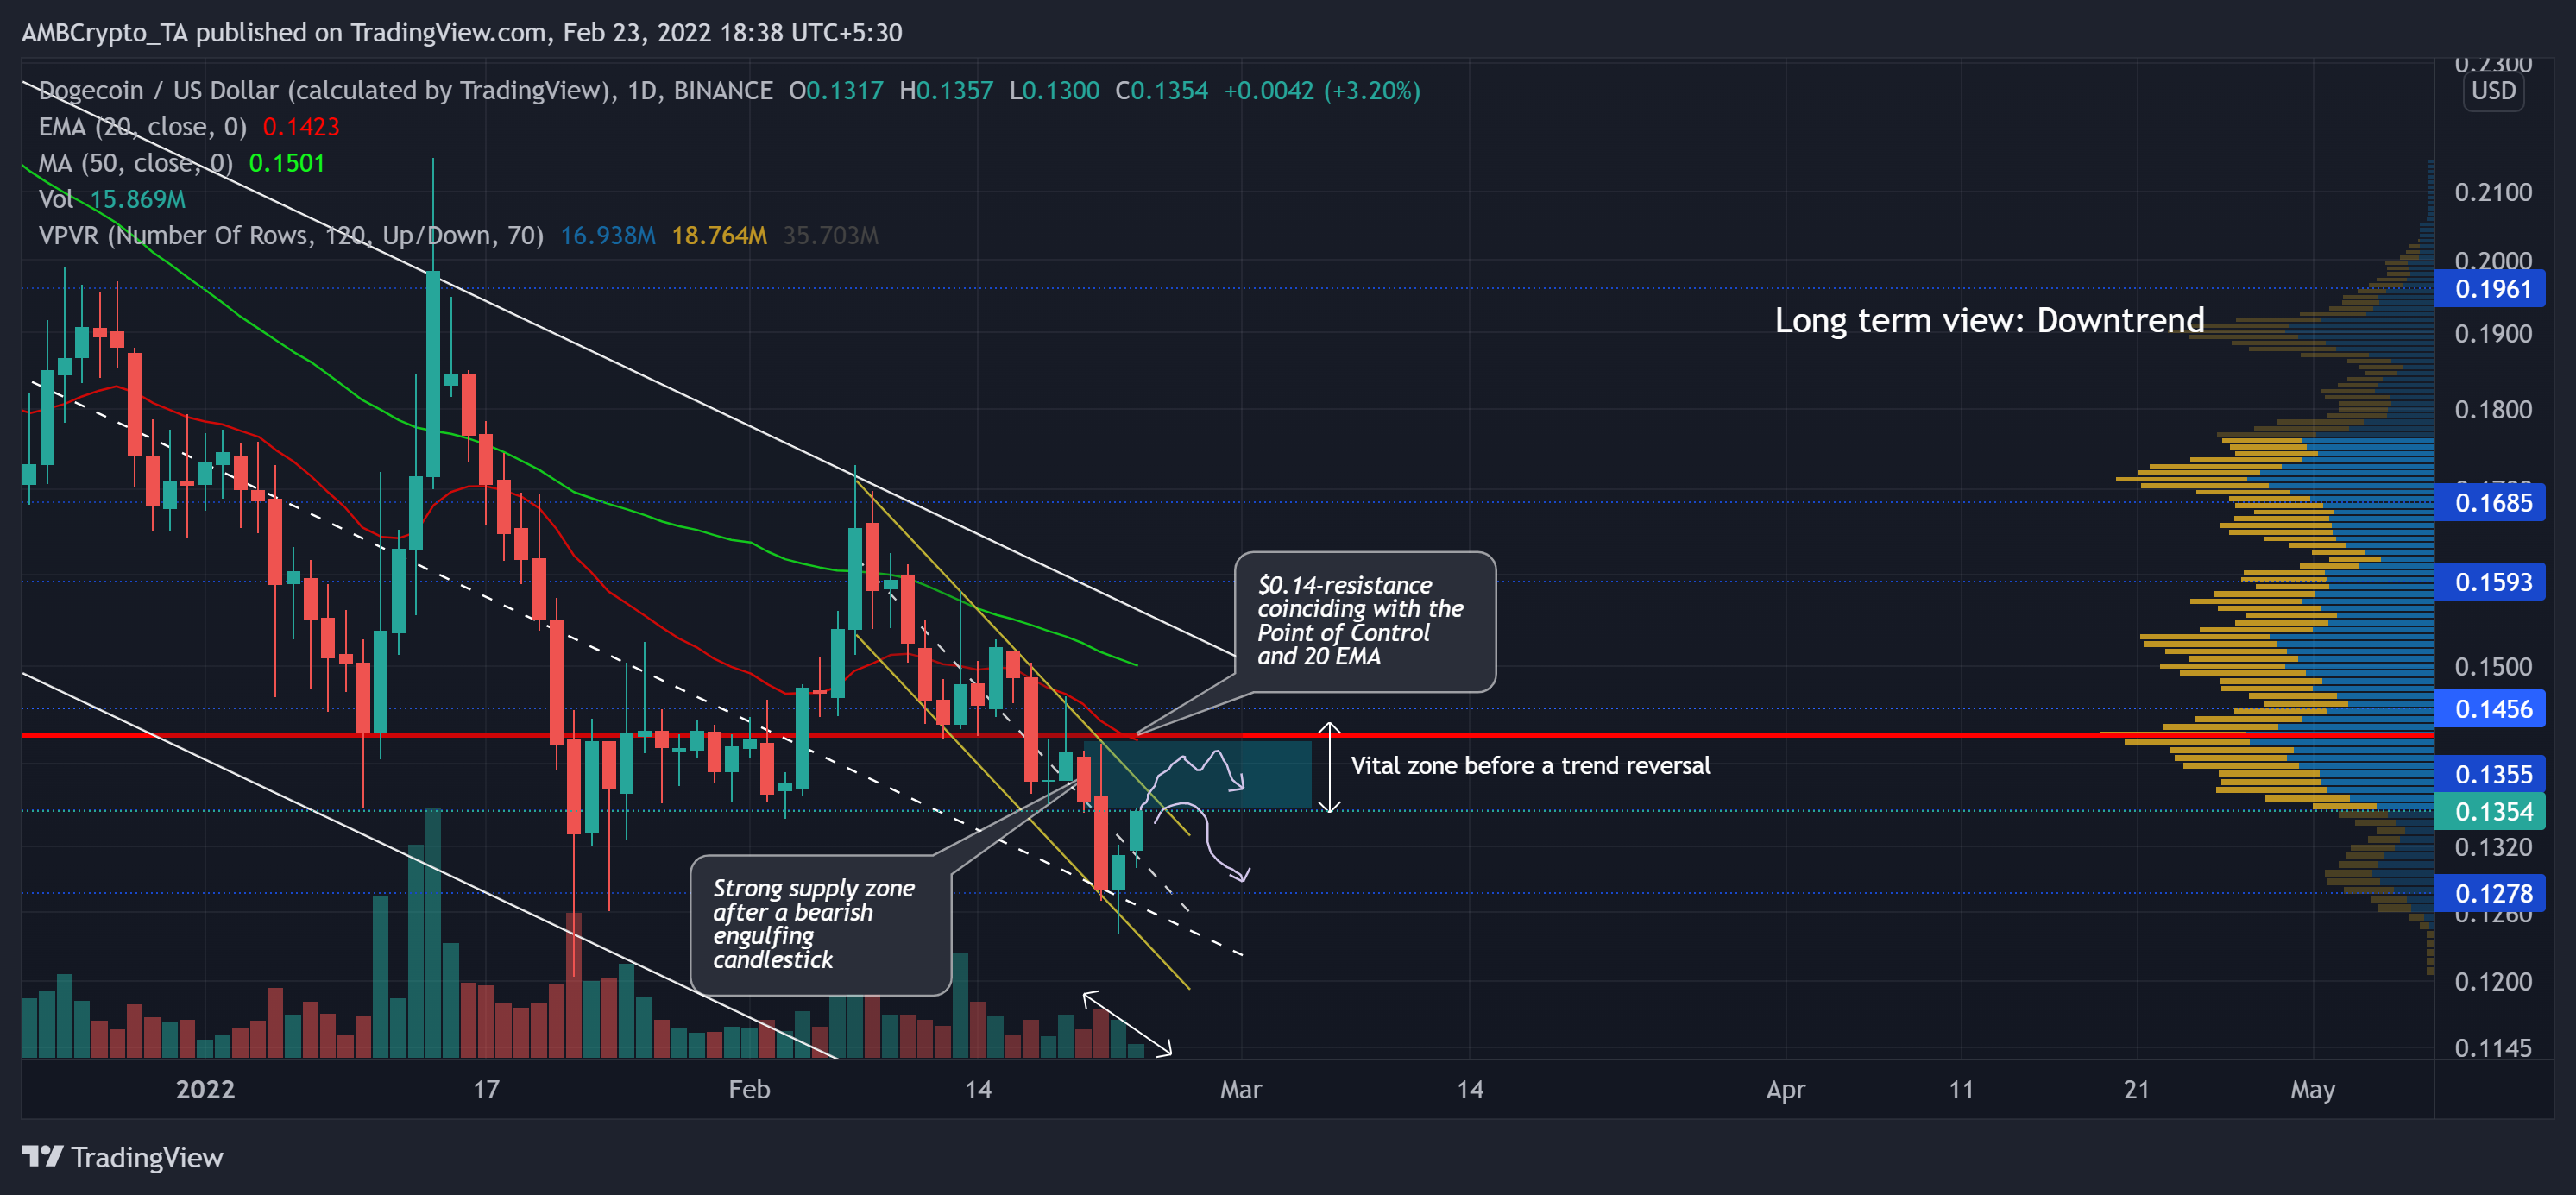
Since its October highs, the alt has declined by over 66% as it plunged towards its nine-month low on 22 January. During this phase, the 50-SMA (green) was a strong selling point, one that shunned all substantial bullish recovery attempts.
The downslide led the dog-themed coin to lose the crucial $0.1355-mark, one that the bulls upheld for nearly ten months. The latest bearish engulfing candlestick created a strong supply zone between the $0.135-$0.14 range. Furthermore, the two-month Point of Control (red) and the 20 EMA reaffirmed a likely clash between the buyers and sellers at this range.
Going forward, if the current buying spree continues beyond the upper trendline of its recent down-channel (yellow), DOGE will eye a test of the $0.14-mark before a reversal. But, volumes have been rather heavily declining, hinting that a breakout would not be sustainable.
If the sellers start to take control of the price, a retest of the $0.12-level before a strong reversal should not surprise investors.
Rationale
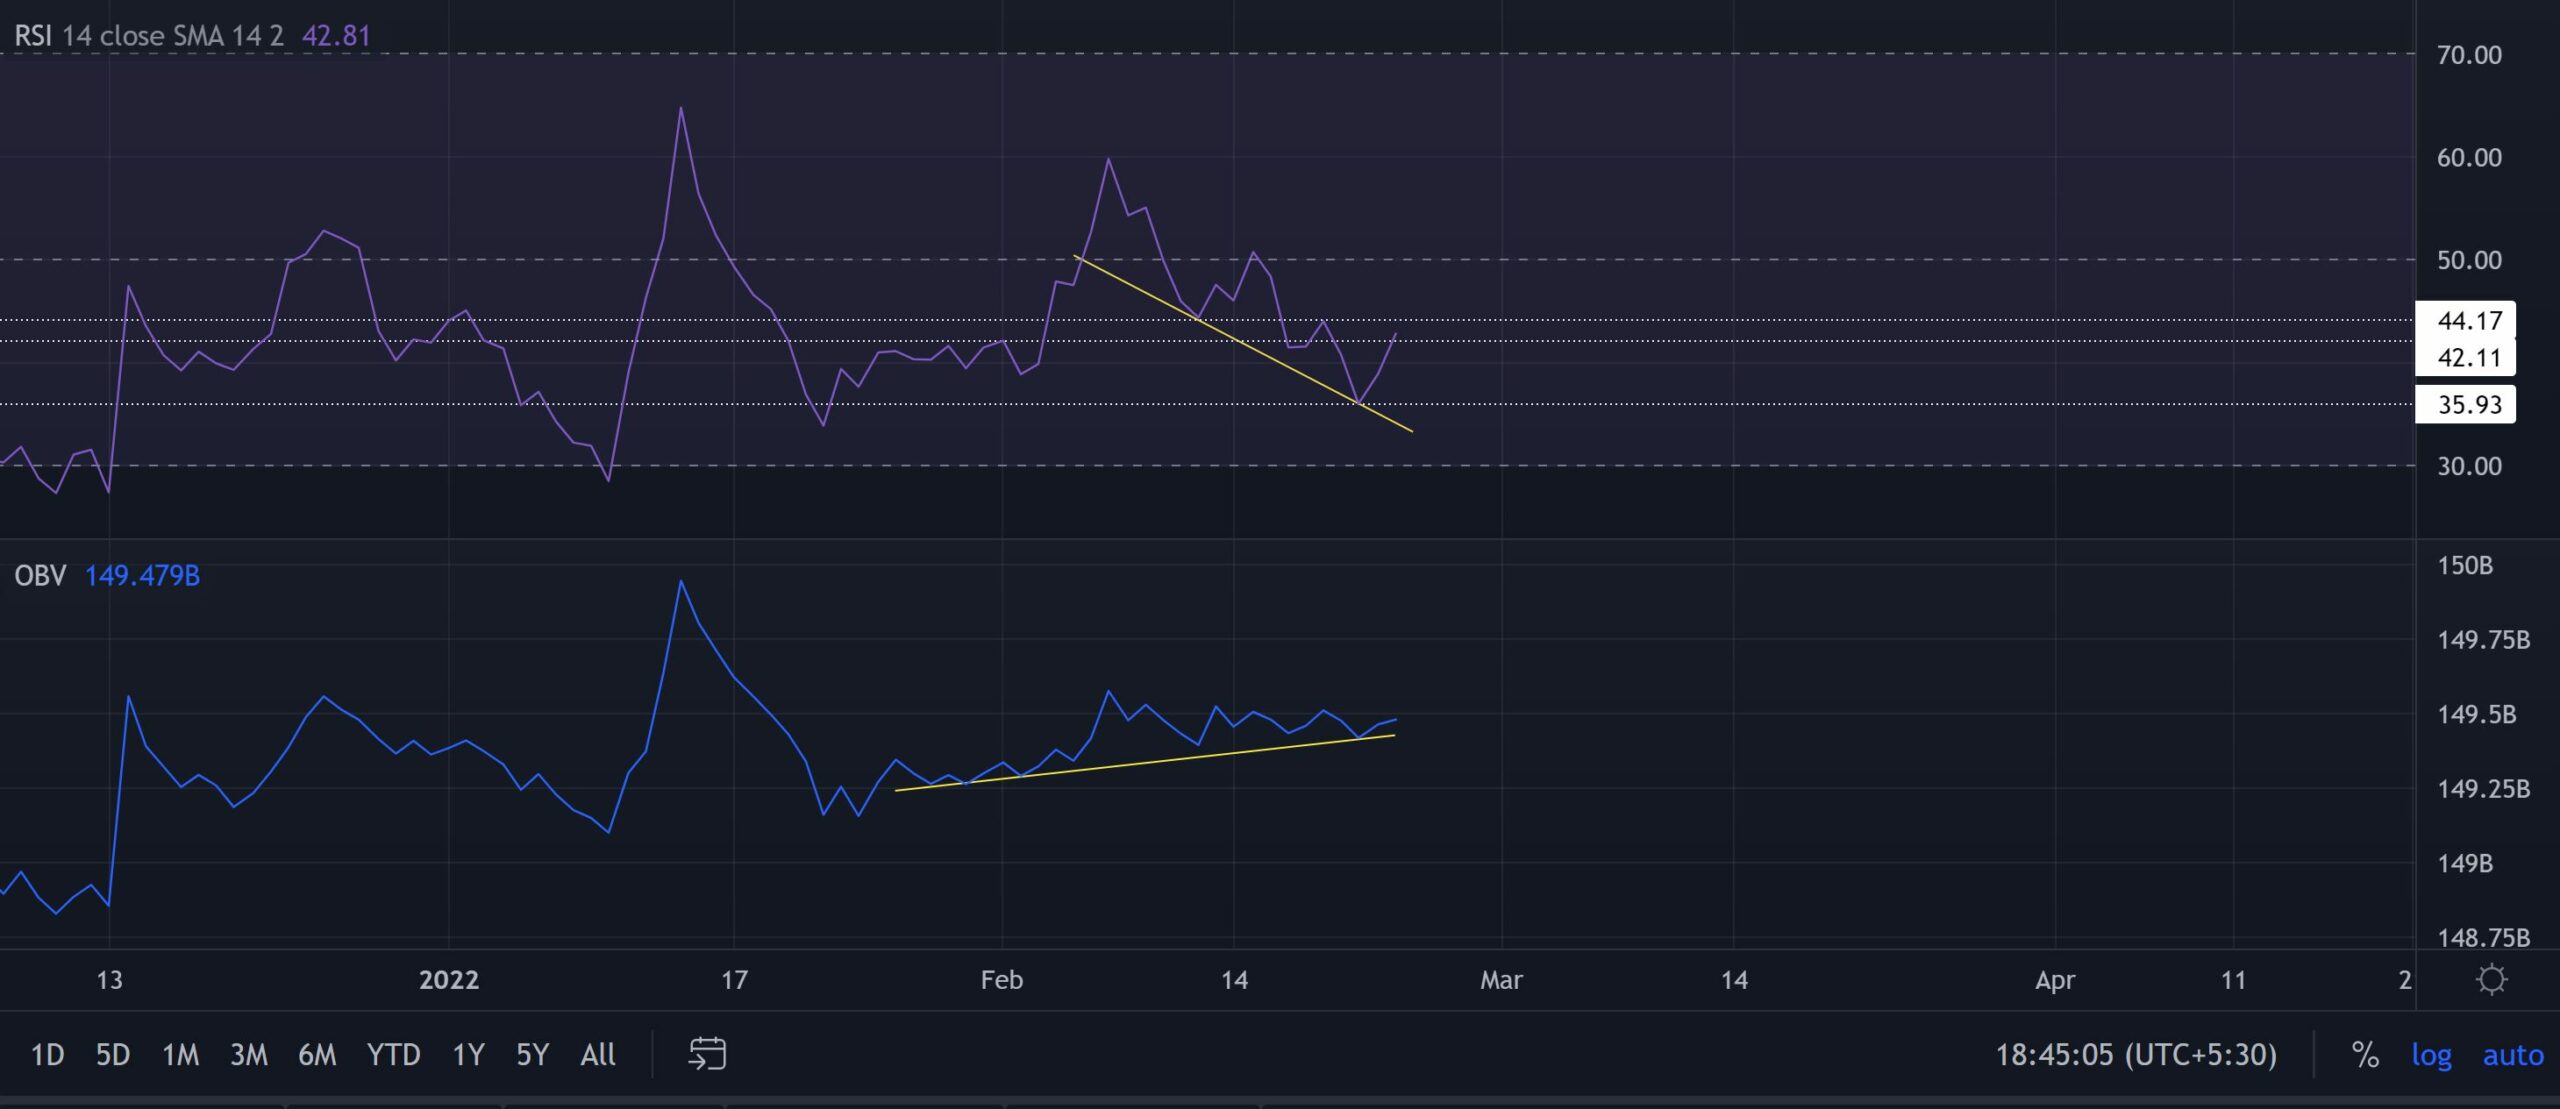
The RSI picked itself up from the 35-support as it endeavored to challenge the 42-44 range resistance. It still needs to close above this range to topple its equilibrium.
Interestingly, the OBV witnessed higher troughs and formed a bullish divergence with the price. This reading kept the $0.14-retest hopes alive in the days to come.
Conclusion
Considering the bullish divergence between price and OBV, DOGE could test its Point of Control before facing resistance and entering a possibly tight phase. However, the meme coin shares a 77% 30-day correlation with the king coin.
Thus, keeping an eye on Bitcoin’s movement would be vital to complement these technical factors.


