EOS, Cosmos, Dash Price Analysis: 18 February

EOS was strongly bullish on the price charts, with EOS primed to climb back above $5 once more. Cosmos saw its recent momentum come to an abrupt halt while Dash formed a bullish pattern on its 4-hour charts.
EOS
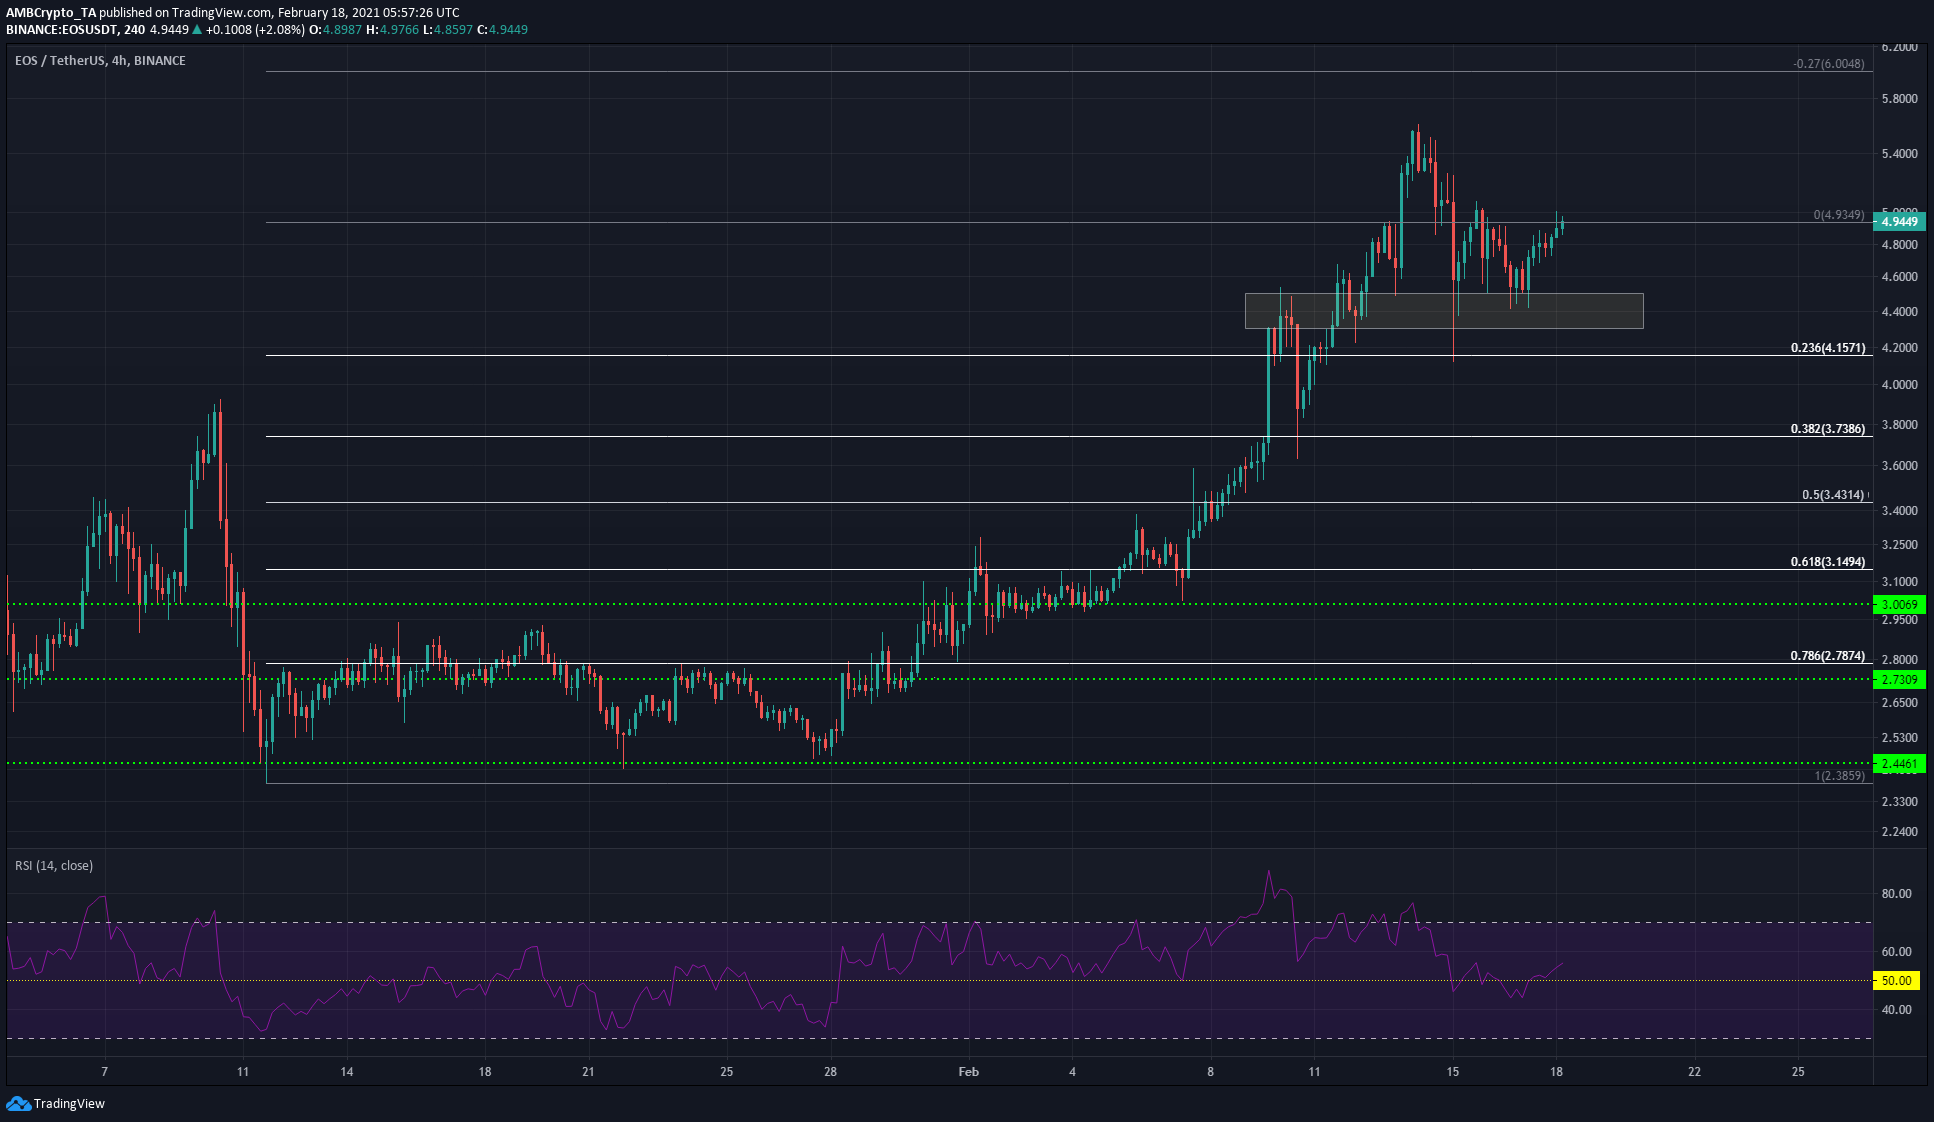
The highlighted area around $4.4 has served as a region of demand for EOS in the past. The RSI rose back above 50 in recent trading sessions to underline bullish momentum once more.
This showed that EOS looked to be poised once more to climb above $5 and target the previous high at $5.5. Failure of the market’s bears to force the price under the region of demand is a sign of bullish strength, and the levels of $5.5 and $6 above it will be likely targets for EOS over the next few days.
Cosmos [ATOM]
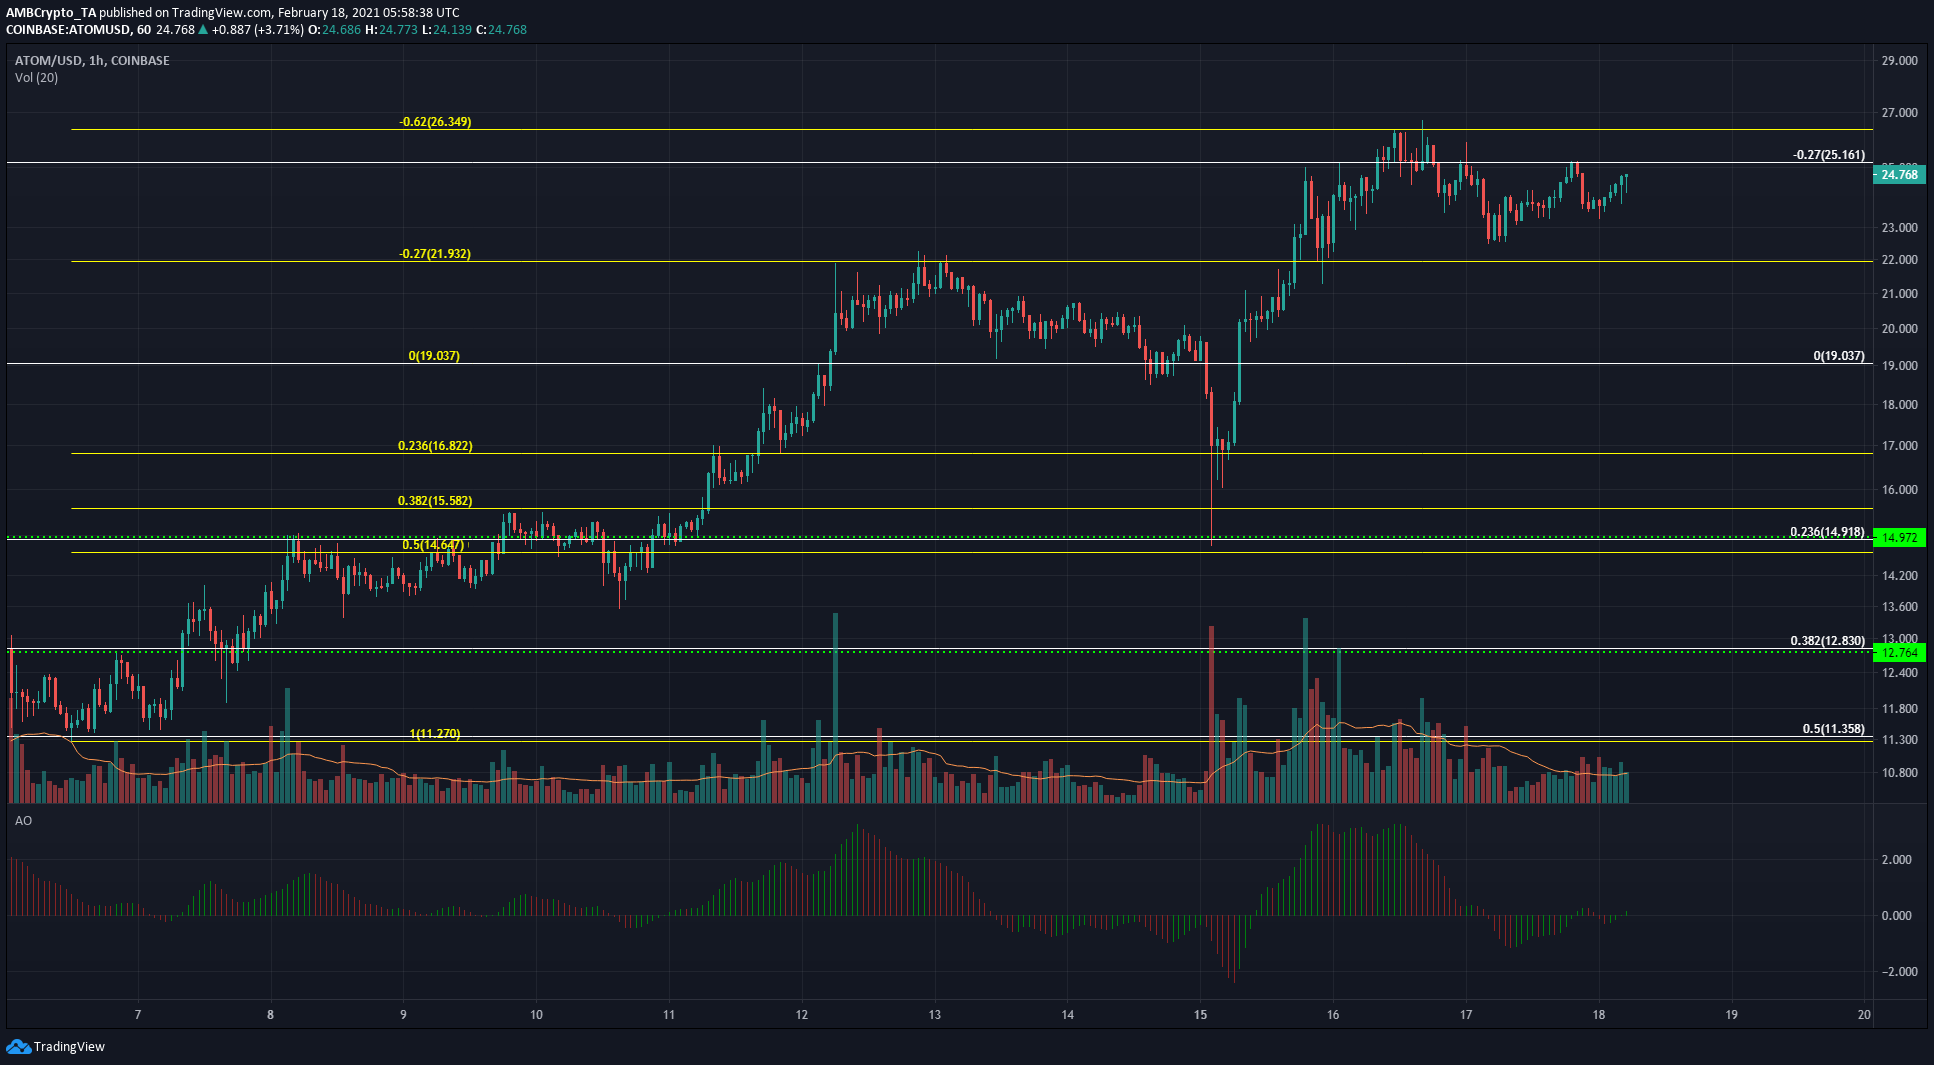
Using two sets of retracement levels for ATOM’s move up to $19, it can be seen that the 27% and 62% extension levels have proven useful in demarcating areas of supply and demand. The $25-$26 region was one of supply, at the time of writing.
In the short-term, the Awesome Oscillator showed neutral momentum in ATOM’s market, even as trading volumes dropped. The price made a lower high, signalling a brief phase of consolidation and possibly, even a pullback.
A breakout past $26.4, as well as a retest of $22, will both present buying opportunities for ATOM. Since momentum is still strongly in favor of the bulls in the long-term, a breakout past $26 is likely.
Dash [DASH]
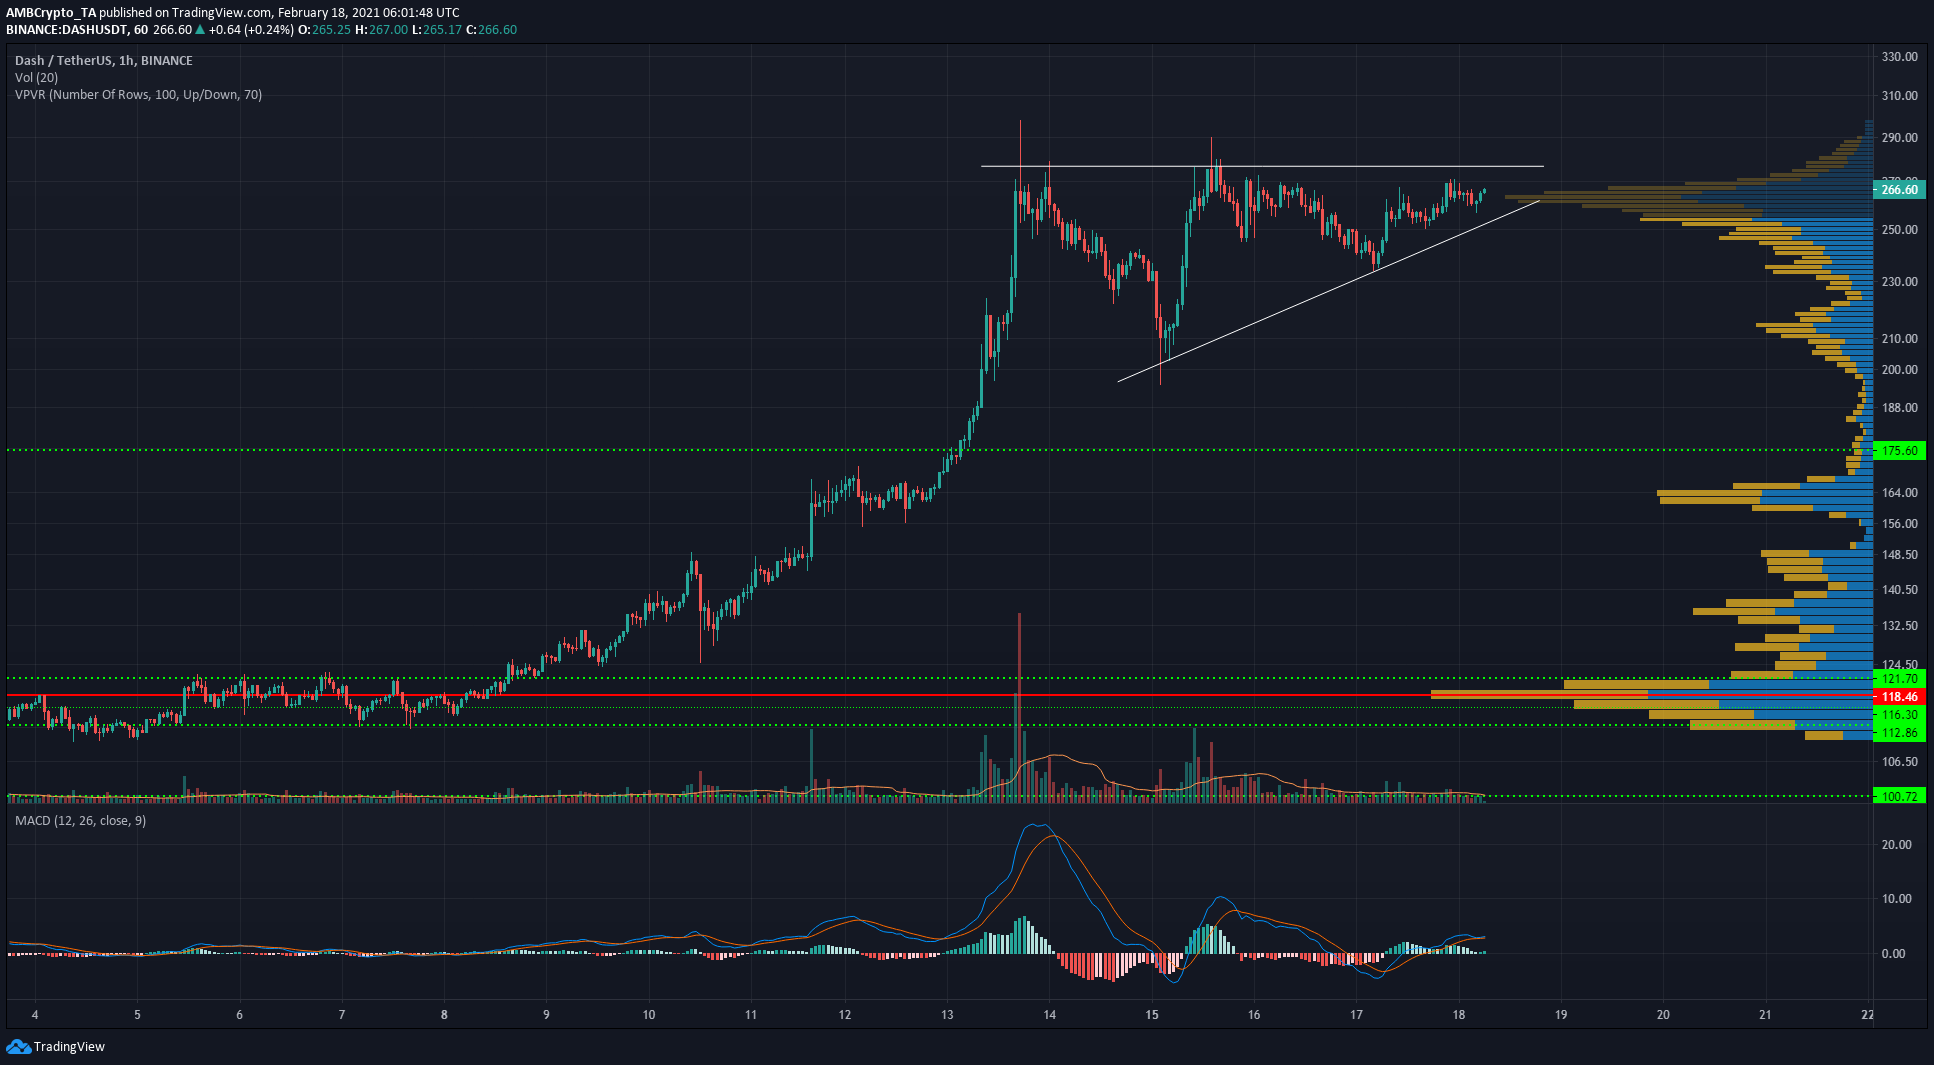
Dash registered huge gains over the past few weeks. In the short-term, the coin formed an ascending triangle pattern on the charts. This pattern generally sees a bullish breakout. Closing under the pattern would invalidate a move north, and would likely point towards a retracement.
The MACD formed a series of lower highs to highlight an exaggerated bearish divergence. A move below $240-$250 would be a blow to the market’s bulls.
The Visible Range Volume Profile showed that trading activity has been most notable at $260 over the past few days, and losing this region would see DASH drop towards $220.